I am Article Layout

Now Reading: Barometer: A tactical opportunity emerges in equities

Select your investor profile:

This content is only for the selected type of investor.

Barometer of financial markets February 2024 outlook

February 2024
Marketing Material

Barometer: A tactical opportunity emerges in equities

As inflation continues to slow and economic growth remains resilient we upgrade stocks to overweight as part of a tactical move.

01

Asset allocation: window of optimism

For once, it has been quite a positive start to the new year – at least as far as the world economy is concerned. Slowing inflation appears to justify a pivot in monetary policy towards interest rate cuts, while growth has been resilient enough to suggest that the economy can avoid a hard landing.

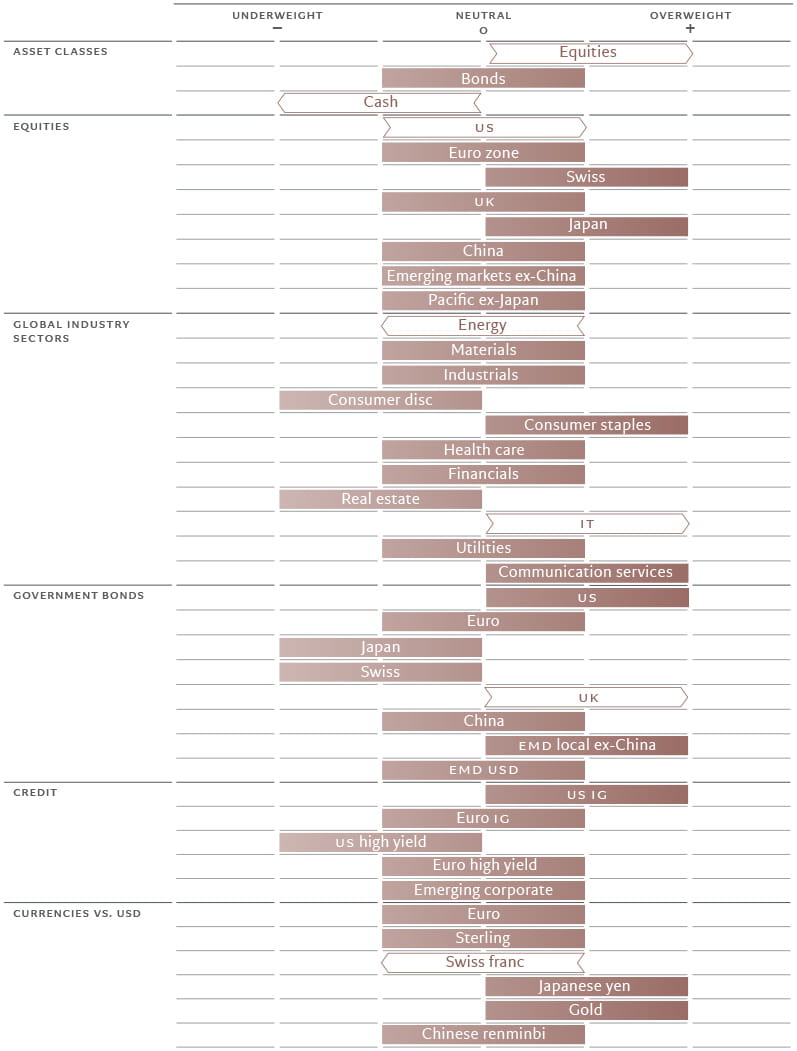
As long as this Goldilocks scenario holds, riskier assets should benefit. Therefore, we upgrade global equities to overweight, balancing this with an underweight in cash. As interest rate cuts start to come through, holding money in cash or equivalents will become increasingly unattractive. Our stance on bonds, meanwhile, remains neutral.

We view this allocation shift as a short-term move. Much like Goldilocks’s porridge won’t stay the perfect temperature for ever, we believe the global economy will eventually start to cool and bonds will regain the upper hand over equities.

Fig 1. Monthly asset allocation grid
February 2024
baro grid
Source: Pictet Asset Management

Indeed, our global leading indicator of business activity points to a likely slowdown going into the second half of the year. We expect growth in developed economies to total just 0.9 per cent for 2024 – roughly half the pace of the previous year.

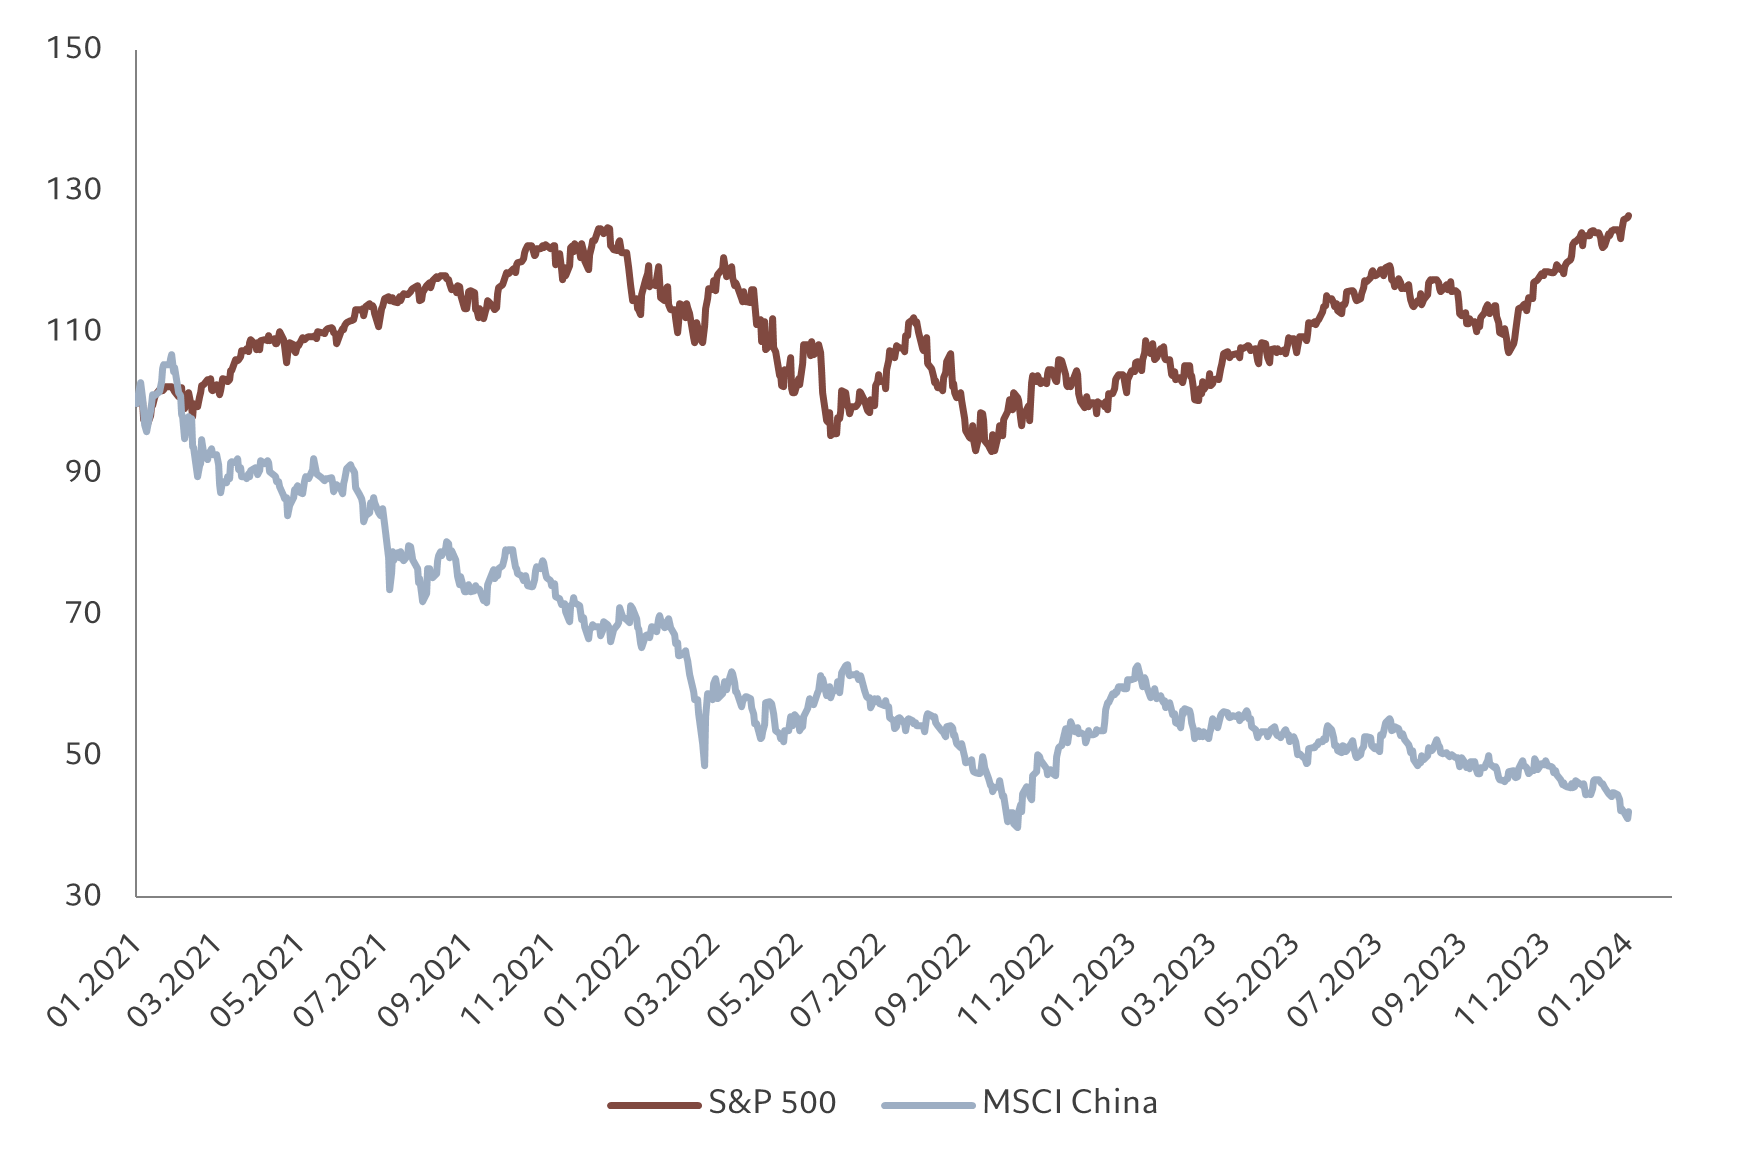
Japan remains the only developed market with a positive score in our macro-economic model, with strong wage growth and potential rebound in global trade providing strong tailwinds.

The US economy is also holding up relatively well so far, which should boost its equity market in the near term. But survey data is increasingly gloomy, and we expect dynamics in the consumer sector and non-residential investment to deteriorate soon, prompting the US Federal Reserve to cut rates.

Growth in the euro zone, meanwhile, will likely be anaemic, albeit stable.

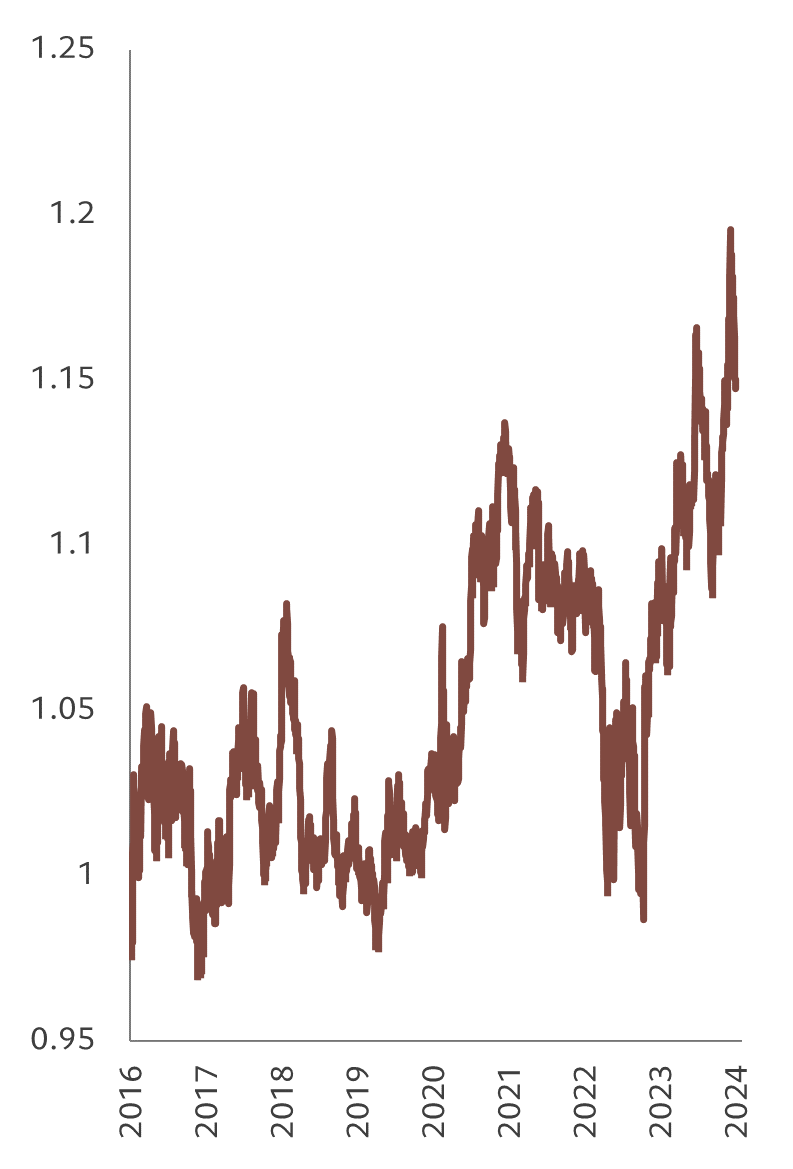
Our liquidity indicators show conditions will remain supportive for stocks, and US equities in particular, till the end of the first quarter. The Fed’s quantitative tightening programme has failed to make a dent, as it has been more than offset by financial institutions withdrawing their surplus cash parked with the central bank (see Fig. 2). This has helped risky assets outperform cash, restoring a degree of the ‘policy put’. Our analysis suggests that the increase in net liquidity – the additional amount of money the central bank provides the economy for investment and spending –is consistent with the S&P 500 grinding higher towards the 5,000 mark.

The situation is likely to change once the US Treasury shifts issuance to longer-dated bonds rather than T-bills, which we expect to occur the second quarter of 2024. This will result in a significant slowdown in the reduction of the Fed's reverse repo facility , a net drain of the liquidity in the financial system and a likely increase in risk premia. 

Fig. 2 - Liquidity boost
Fed net liquidity (monthly change in USD billion) versus S&P 500 price-to-earnings ratio
AA - Fed liquidity

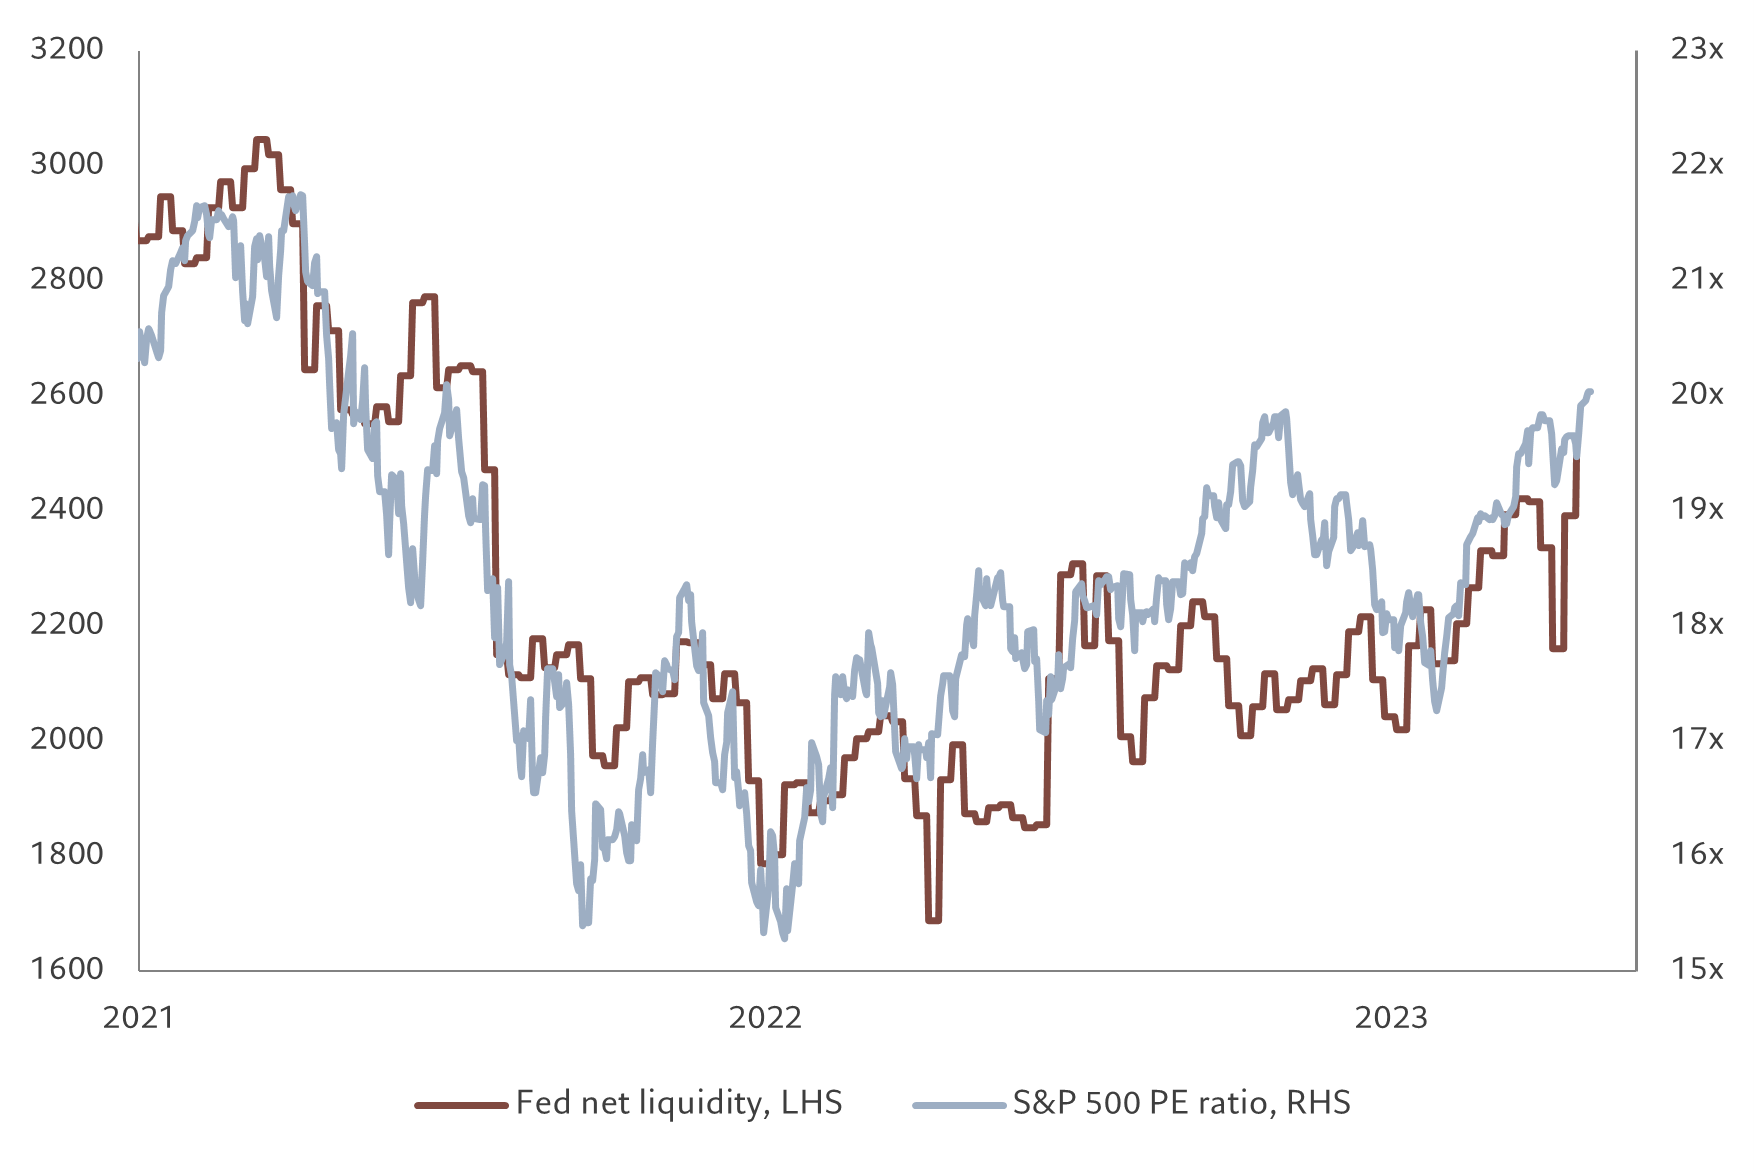
Fed net liquidity refers to the central bank's injections or withdrawals of funds from the financial system. Source: Refinitiv DataStream, Pictet Asset Management. Data covering period 13.12.2019-23.01.2024.

At that point, the stretched equity valuations will likely start to look unsustainable. US stocks appear expensive trading on 20 times their 12-month forward earnings – a level rarely sustained outside of the dotcom bubble. Improved earnings prospects offer some comfort, especially in the tech sector (and consequently for US), but the upside is limited given the lofty expectations that are priced in  - consensus earnings per share growth for the US market is above 10 per cent against our forecasts of 4 per cent.

Our tactical preference for equities is also underpinned by positive  technical signals, especially strong trends in US and Japan. Sentiment indicators have normalised from euphoria territory, while investor positioning shows a balance between call and put options, or between investors betting on a market rally versus those bracing for a rout.

02

Equities regions and sectors: warming a little to the US

The US corporate reporting season is in full swing and results so far confirm our expectations that America Inc is at the beginning of an earnings recovery that can be sustained through the course of this year.

With the US economy remaining resilient, we have raised our US corporate earnings growth forecasts for this year to 4.3 per cent from our previous 2.5 per cent.

At first glance, the profit upgrade would suggest holding an overweight position in US stocks. But there are risks in taking that stance.

We cannot rule out, for instance, that US household spending will slow in the coming months. Nor can we discount the possibility of a deterioration in business investment.

What is more, the Fed's expected easing cycle is unlikely to bring a liquidity boost as interest rate cuts would merely keep real rates unchanged.

Then there is the equity risk premium -- an excess return that investing in the stock market provides over a risk-free rate. In the US, the ERP stands at 3.8 per cent, the lowest of all developed equity markets. Taking all this into account, we have decided to raise our US equity allocation to neutral, but stop short of an overweight.

There are more attractive investment opportunities in other developed markets.

We remain overweight Japan. Tokyo stocks are going from strength to strength as the country’s economic resilience, corporate reforms and reasonable valuations attract more inflows to the market, where the benchmark Nikkei index hit its highest level in nearly 34 years in January.

Swiss stocks remain an overweight too as the market provides exposure to quality and defensive stocks, which we consider are important holdings in an environment of moderate global growth. The country has the highest share of defensive stocks among major economies – at 60 per cent of the Swiss benchmark index’s market capitalisation. These are mainly pharmaceuticals and consumer staple businesses.

We remain neutral on euro zone stocks. While valuations are attractive, the outlook for the economy remains poor. That said, as an unloved region with prospects of an economic recovery in the second half, euro zone stocks have the potential to surprise later in the year.

Elsewhere, we remain neutral China and other emerging markets. While Chinese stocks’ relative valuations are at an all-time low, prospects for the asset class are not particularly bright as investors doubt the willingness of Beijing to deliver large-scale fiscal support to revive the stock market. What is more, turnaround in the property market, which is key for an improvement in sentiment, is not in sight.

Fig. 3 - IT ahead of the pack
Sectors in MSCI World Index 12-month EPS estimates (rebased to 100 pre-Covid)
Equities - tech
Source: MSCI, IBES, Refinitiv DataStream, Pictet Asset Management, data covering period 21.01.2020 – 23.01.2024

When it comes to sectors, we upgrade information technology to overweight. The sector offers the strongest earnings growth estimates at a time when revisions are positive for both 2023 and 2024 (Fig. 3) 

What is more, growth opportunities for companies operating in the sector, particularly those generated by advances in artificial intelligence (AI), justify IT’s lofty valuation.

We also like communication services stocks, which offer exposure to the AI theme while providing more reasonable valuation.

We downgrade energy to neutral from overweight. We no longer see value in using oil stocks as a hedge trade against geopolitical risks in the Middle East.

03

Fixed income and currencies: glittering gilts

Although we’re optimistic for fixed income generally through the year, we see particularly good value in UK government bonds, which we upgrade to an overweight from neutral. The bonds are relatively cheap, not least because we consider the recent upward surprises in UK inflation numbers to be transient. Instead, we expect inflation to start falling again in response to weakness in the economy. This is already being reflected in softening inflation expectations. Easing price pressures will, in turn, give the Bank of England the room to start its easing cycle and cut rates before any other of the developed world’s major central banks.

We remain overweight US Treasury bonds. Our model suggests that their yields will drop another 20 basis points by the year end. At the moment, there’s too much optimism about how fast and deeply the Fed will cut interest rates this year, but at some point later in 2024 we expect the turn in the interest rate cycle to give US government debt a further fillip.

We are also overweight emerging market local currency debt - the asset class has underperformed so far this year, but the Fed's dovish turn and carry in part makes up for this risk.  We remain underweight Japanese and Swiss bonds - the Bank of Japan is on the cusp of a tightening cycle, while the Swiss National Bank has limited room to cut, which means both markets are likely to underperform at a time when rate cutting cycles are set to begin in much of the rest of the developed world.

Fig. 4 - Peaky
CHF/USD exchange rate
FI - CHF to USD V2
Source: Refinitiv, Pictet Asset Management. Data covering period 23.01.2014 to 23.01.2024.

In credit, we continue to like the relative trade of overweight US investment grade and underweight US high yield. Spreads between the two asset classes are too tight relative to the muted economic momentum suggested by leading economic indicators. When compared to government bonds, we think that high yield bonds do not offer adequate compensation to take on additional risk. 

Elsewhere, in our currency grid, we downgrade the Swiss franc to neutral. The currency outperformed through 2023 (see Fig. 4). The SNB has now changed its currency policy forward guidance: a few months ago it embraced Swiss franc strength as a means of calming inflation, but now that the inflation target is reached, the central bank has announced it will no longer sell foreign currency. 

We are also overweight gold which should benefit from another bout of rates rallying, and an eventual US dollar depreciation. We are also overweight the Japanese yen, which continues to present a compelling valuation argument. 

 
04

Global markets overview: all about rates - for now

Global bonds underperformed equities at the start of the year, ending the month in the red as guidance from major central banks poured cold water on the idea that interest rate cuts might be delivered this quarter.

Fed chair Jay Powell said a March cut was not “the base case” as the central bank would want to wait for proof that the fall in inflation is sustainable, but he left the door firmly open for cuts later in the year. US Treasuries finished January down 0.3 per cent.

Weakness was much more pronounced in UK gilts, which lost 1.9 per cent in local currency terms, reversing some of the sharp gains seen at the end of 2023. UK inflation unexpectedly rose to 4 per cent in December, its first increase in 10 months.

In the euro zone, too, the front end of the bond market repriced to reflect a more hawkish rates outlook. The bloc’s government debt weakened by 0.6 per cent.

While bonds floundered, equities held up relatively well, adding 1.3 per cent on a global basis. However, the strong aggregate performance masked big differences between regions and sectors.

Among the latter, IT and communications services were the star performers thanks to some positive results from major tech firms. Chipmaker ASML, for example, reported a tripling of orders. Materials, real estate, utilities and consumer discretionary sectors, meanwhile, all lost ground.

The trend of “IT versus the world” is reflected in valuations. In the US, for example, the S&P500 trades at a 12-month forward price/earnings ratio of 20 times, but within that the median stock trades at 17.5 times, while the “Magnificent 7” tech giants now trade at 30 times.

Fig. 5 - US takes upper hand
S&P 500  versus MSCI China (rebased to Jan 2019)
Markets - US and China

Source: Refinitiv DataStream, Pictet Asset Management. Data covering period 22.01.2021-23.01.2024.

Among regions, China extended its long-running streak of underperformance compared to the US. While the S&P 500 has added some 27 per cent since January 2019, MSCI China has lost 58 per cent over the same period (see Fig. 5). Even though there was some good news about the Chinese economy, concerns remain about whether GDP growth can pass through into higher corporate earnings – something it has so far largely failed to do. News that property group China Evergrande Group had received a liquidation order from a Hong Kong court was a reminder of the challenges in China’s real estate market.

Conversely, Japanese stocks outperformed, gaining 8.5 per cent in local currency terms thanks to the country's economic resilience, corporate reform and a still-weak yen. Swiss stocks also posted gains, albeit more modest ones, as investors value its exposure to quality stocks.

In currency markets, the prospects of higher US rates for longer supported the dollar, which gained ground against most major currencies.

05

In brief

Barometer february 2024

Asset allocation

In the face of slowing inflation and relatively resilient growth, we upgrade equities to overweight, balancing this with a downgrade of cash holdings.

Equities regions and sectors

We upgrade US to neutral and IT to overweight; Japan and Switzerland remain our preferred markets.

Fixed income and currencies

We upgrade UK government bonds to overweight from neutral on expectations UK inflation will slow; and we downgrade the Swiss franc to neutral from overweight following its strong run.