Emerging market corporate bonds begin to sparkle
Emerging market credit offers some of its most attractive yields relative to risk for many years, particularly in light of strong corporate and economic fundamentals.
Written by

Sabrina Jacobs
Senior Client Portfolio Manager
Professional investors joke that the UK is turning into an emerging market (EM). This is a disservice to actual EM economies. In fact, in some respects less developed countries are proving a relative haven of stability – not least in the corporate bond market.
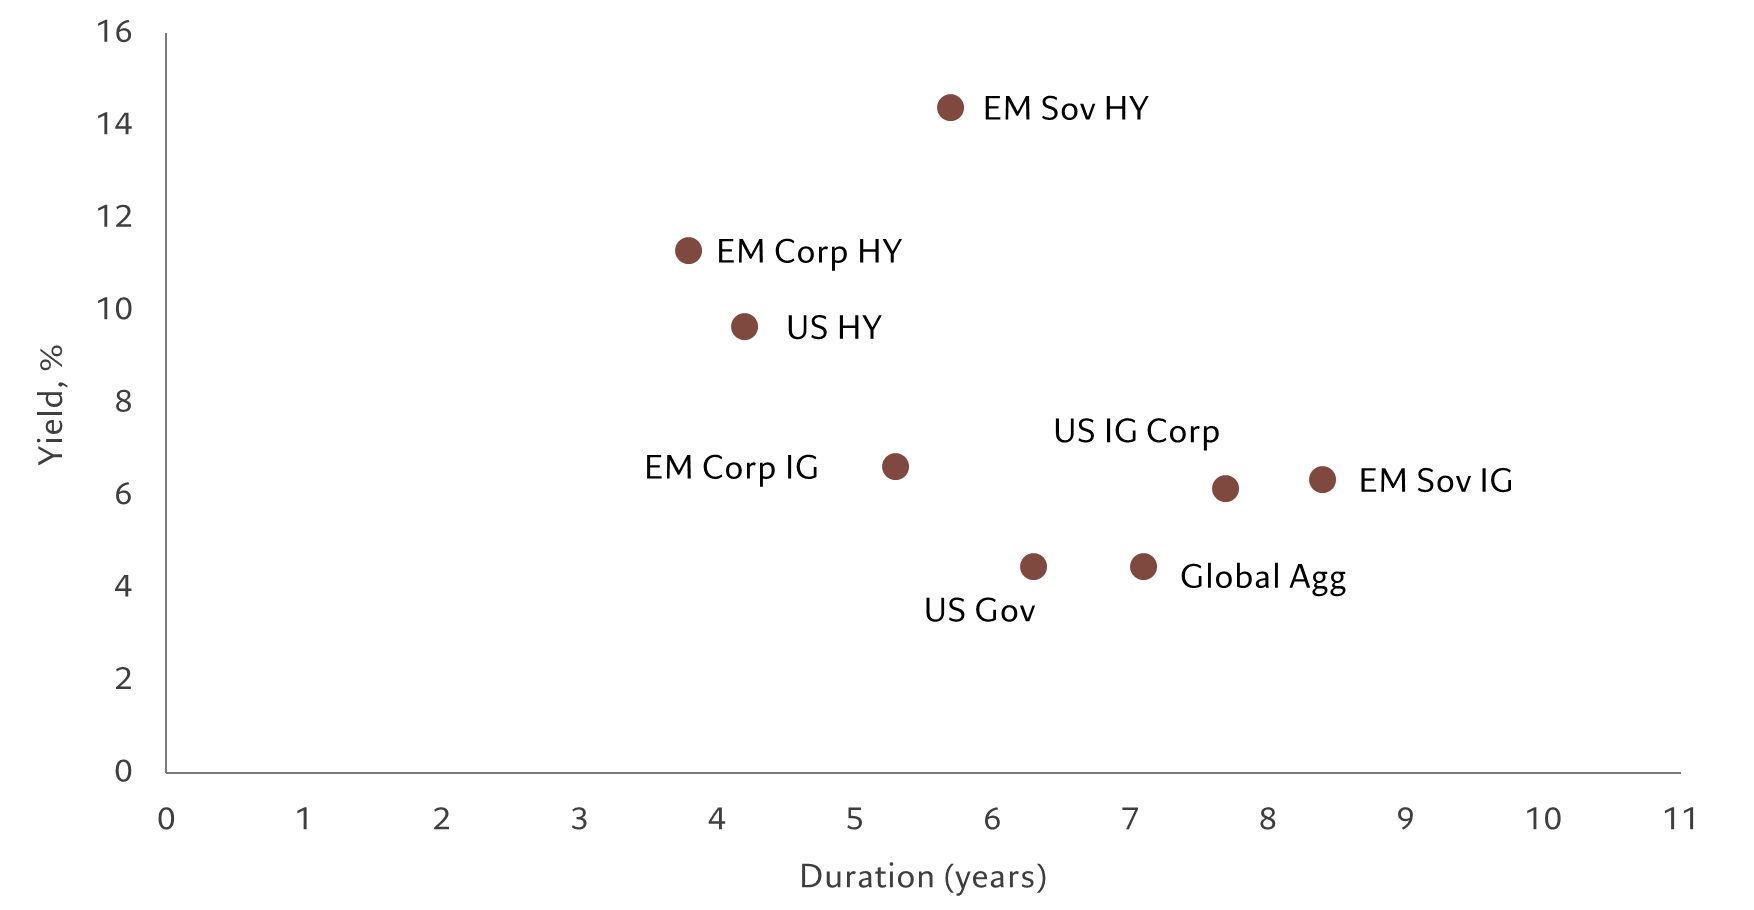
Broadly speaking, EM corporate borrowers are less vulnerable to capital flight than in the past due to greater local investor ownership of their bonds, have relatively low leverage and are by and large based in countries with robust macro-economic fundamentals. And at a time of general bond market volatility, yields on short duration EM corporate credit look particularly attractive (see Fig. 1).
Of course there is plenty of variation between regions and sectors, so investors need to be diligent in analysing corporate nitty gritty as well as having good understanding of the macro-economic picture. But such efforts are likely to be well rewarded: in many cases, EM corporate bonds are cheap compared with their fundamentals, such as, for instance, the yield spread they offer relative to leverage.
Fundamental attractions
EM companies have done exceptionally well so far in 2022, with revenues up 22 per cent and earnings up 27 per cent during the second quarter on the same period a year earlier. At the same time, their balance sheets are looking healthy, with net debt down 7 per cent year-on-year in the second quarter. This has helped reduce the net leverage ratio to some 1.2 times from 1.3 times in 2021 (excluding Russia and Ukraine for obvious reasons and real estate), according to JP Morgan research.
Many EM companies have built up their profit margins in the wake of the pandemic. This, in turn, leaves them better able to absorb among other things, higher costs from commodity price inflation. Take steel companies in India. The sector has been one of the hardest hit from rising input costs and more recently export taxes. Yet, due to their post-pandemic profit surge, domestic operators have been able to absorb a reduction of 6 percentage points in profit margins to a 12–month average of 21 per cent in Q1 versus a peak of 27 per cent last year.
For credit investors, this still represents a good margin of safety. Furthermore, while these rising input costs might prompt a tick up in leverage, large Indian steel makers have also been on a deleveraging trend for the past few years. Similarly, most other commodity exporters have been doing well.
Fig. 1 - High yield, low duration
Yield vs. duration for various classes of fixed income, % and years respectively
Meanwhile, many retail-focused companies and those with premium products are in a strong position to maintain pricing power and thus keep up with inflation. In China, large and highly rated tech companies have maintained strong margins as their ultimate customers are to a good extent retail, as well as to the fact that inflation has been running at a considerably lower rate in China than elsewhere. Signals from central government that its regulatory clampdown has come to an end has also helped. At the same time, US restrictions on Chinese tech is having limited impact, restricted to chipmakers.
At the other end of the spectrum there are industries in which rapidly rising costs cannot immediately be passed on to customers and where there is no natural hedge against foreign exchange volatility, such as telecoms. We generally like the sector for its defensive characteristics and predictability of cash flow. But where companies have issued longer tenured contracts for instance for broadband, this means no opportunity to raise pricing for existing customers in the near-term.
What’s more, the more generic the product, the harder it is for companies to pass on costs. And some sectors have been heavily exposed to the energy shock – those utility companies not fortunate enough to be extracting oil or natural gas are feeling the pinch. This is especially the case for utility companies selling to retail customers, not least where governments have been keen to stem inflationary pressures by limiting how much costs are passed through to households.
Prudent financial policies and balance sheet deleveraging in the past five to 10 years have helped most EM corporations across Europe, Africa and the Middle East to prepare themselves for current financial market disruptions.
The wider good health of the EM corporate universe is reflected in its default rates. Strip out Russia, the Ukraine and Chinese real estate and the default rate is a mere 1.2 per cent year-to-date.
Sticking closer to home
EM corporations are also benefiting from increasingly mature domestic financial markets. Being less reliant on foreign sources of capital means that investment programmes are less prone to the whims of global finance and therefore can be more stable than in the past – domestic sources of finance also tend to be stickier. As these countries have grown richer, their banking sectors have become better able to service increasingly sophisticated domestic savers. Furthermore, domestic banking sector balance sheets have been built up in the wake of the Covid pandemic and thus enabled banks to extend credit actively again.
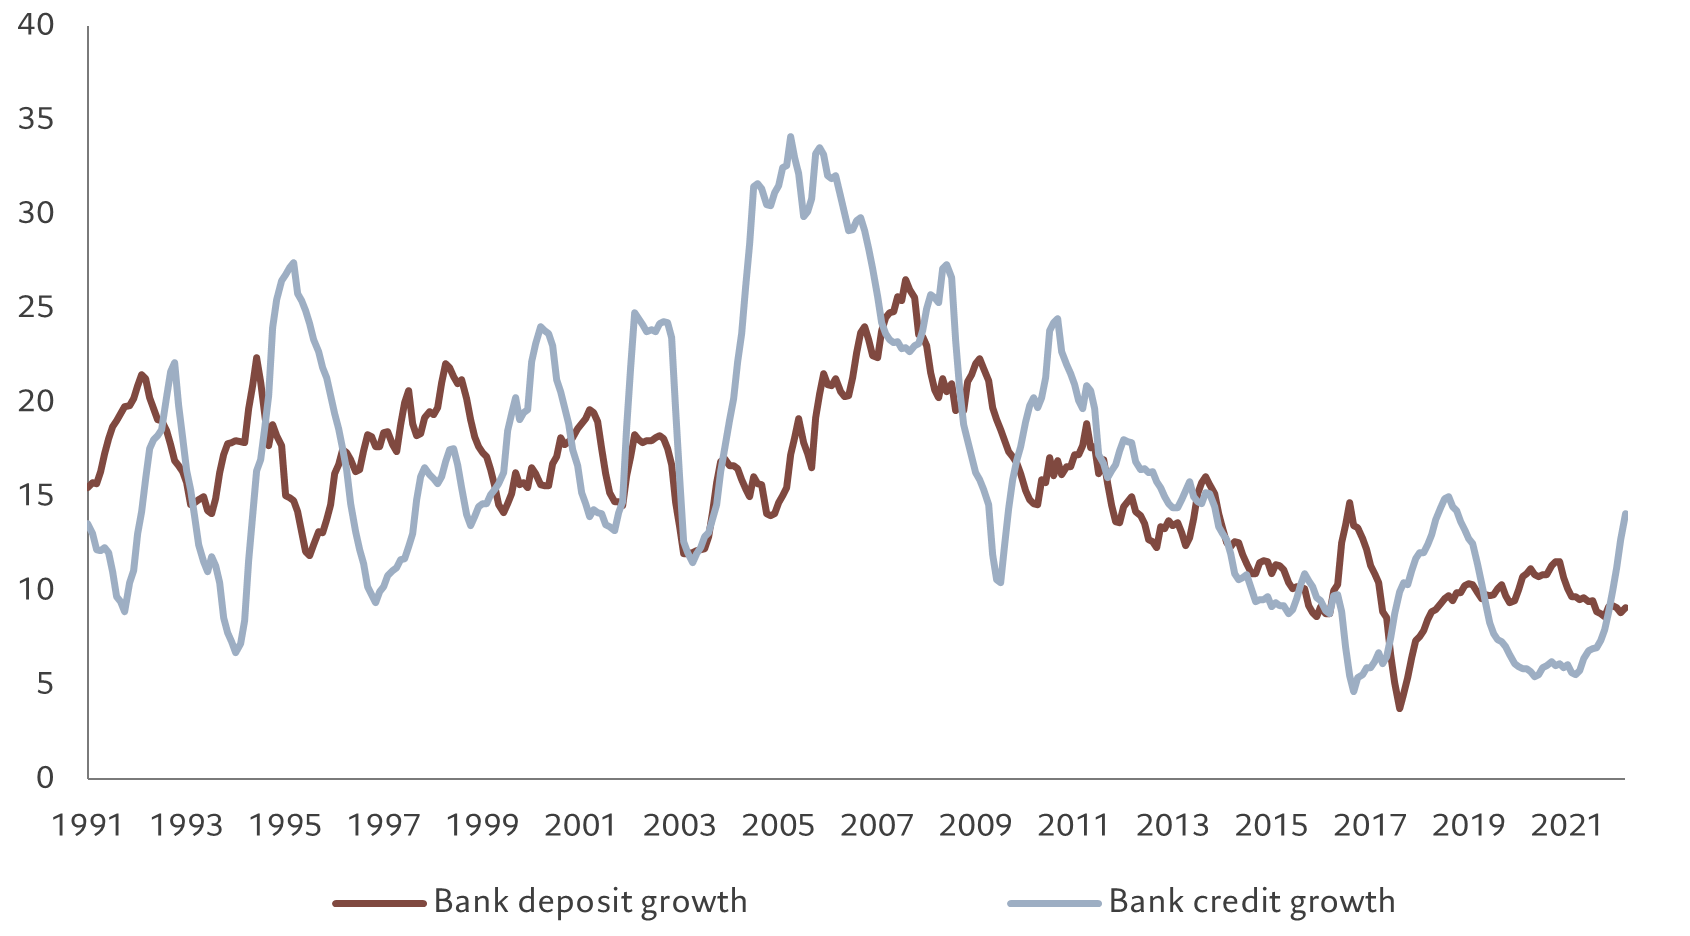
As such, companies in Indonesia, the Philippines and India in particular have increasingly been buying back their outstanding dollar denominated debt and refinanced through cheaper bank loans priced in local currency. That shift is being accelerated by the US dollar’s appreciation and rising US interest rates – increasing the cost of dollar funding - and the cost of these liabilities has helped push companies toward domestic lenders. So, for instance, Indian banks, supported by strong and improving credit quality, have been happy to extend credit and as a result their loan books have grown at a rate of some 12-15 per cent through the first half of 2022 (see Fig. 2).
Fig. 2 - Credit where credit's due
Bank deposits and credit in the Indian banking system
And with many EM central banks either well ahead of developed market peers in tightening monetary policy or not needing to act as forcefully in combating inflation, funding rates there are likely to grow less significantly than they are for dollar borrowers – though determining the balance of effects here needs good macro analysis on the part of investors.
A good place to start
Seasoned investors know that entry points matter. As with other asset classes, EM debt has been battered during the past year. Overall, there was USD62 billion in cumulative outflows by September, though there were signs that this was stabilising, with around a quarter of that likely to have been in credit products.
Spreads over US Treasury bonds are generous – at 400 basis points against a ten-year average of 315 basis points. And given that Treasury bond yields are themselves at highs not seen in a decade, actual EM corporate yields are at levels not seen in years – 8.3 per cent, last seen in August 2009.1
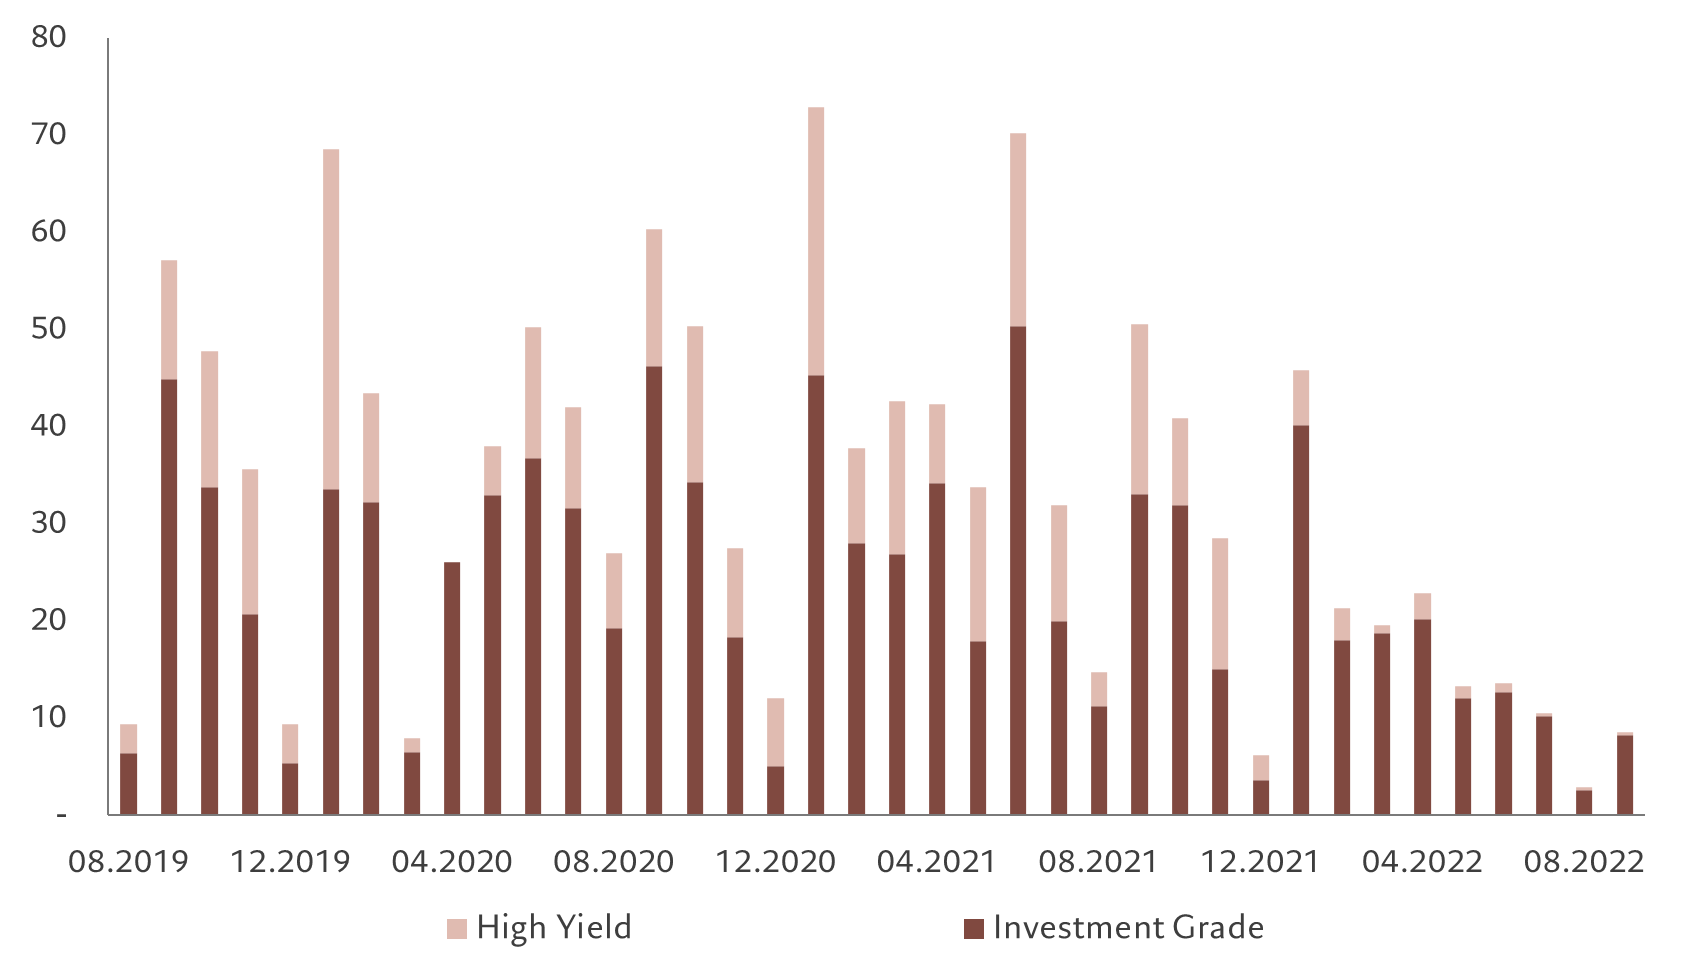
With lower demand and market volatility, gross supply of EM corporate debt has slumped to USD196 billion so far in 2022 (as per end Sept), against around USD450 billion during the same period in 2021 (see Fig. 3). However, EM companies are relatively well insulated against current fixed income market gyrations. Many firms took advantage of historically low rates during recent years to extend the maturity of their debt, so there’s little in terms of a near-term financing wall, especially in high yield EM, where only USD85 billion comes due in 2023, USD95 billion in 2024 and USD100 billion in the following year.
Fig. 3 - Important issues
Monthly EM corporate credit issuance by investment grade and high yield, USD billions.
Times of market stress create opportunities for investors who can pick out the diamonds from the shattered glass. There are plenty of these in the EM corporate universe, where investors are increasingly well compensated for taking on risk with yields that haven’t been seen in many years generated by high quality, well-run companies.
[1] All for JP Morgan CEMBI Broad Diversified as per 14th October 2022; average rating of BBB-.
related articles

Finding opportunities in new frontiers
Frontier markets offer significant attractions to well-prepared investors in both equities and bonds.
February 2022

Which emerging markets are most at risk from US rate hikes?
Our model shows which emerging nations are most vulnerable to a tightening of US monetary policy.
January 2022
Important legal information
This marketing material is issued by Pictet Asset Management (Europe) S.A.. It is neither directed to, nor intended for distribution or use by, any person or entity who is a citizen or resident of, or domiciled or located in, any locality, state, country or jurisdiction where such distribution, publication, availability or use would be contrary to law or regulation. The latest version of the fund‘s prospectus, Pre-Contractual Template (PCT) when applicable, Key Information Document (KID), annual and semi-annual reports must be read before investing. They are available free of charge in English on www.assetmanagement.pictet or in paper copy at Pictet Asset Management (Europe) S.A., 6B, rue du Fort Niedergruenewald, L-2226 Luxembourg, or at the office of the fund local agent, distributor or centralizing agent if any.
The KID is also available in the local language of each country where the compartment is registered. The prospectus, the PCT when applicable, and the annual and semi-annual reports may also be available in other languages, please refer to the website for other available languages. Only the latest version of these documents may be relied upon as the basis for investment decisions.
The summary of investor rights (in English and in the different languages of our website) is available here and at www.assetmanagement.pictet under the heading "Resources", at the bottom of the page.
The list of countries where the fund is registered can be obtained at all times from Pictet Asset Management (Europe) S.A., which may decide to terminate the arrangements made for the marketing of the fund or compartments of the fund in any given country.
The information and data presented in this document are not to be considered as an offer or solicitation to buy, sell or subscribe to any securities or financial instruments or services.
Information, opinions and estimates contained in this document reflect a judgment at the original date of publication and are subject to change without notice. The management company has not taken any steps to ensure that the securities referred to in this document are suitable for any particular investor and this document is not to be relied upon in substitution for the exercise of independent judgment. Tax treatment depends on the individual circumstances of each investor and may be subject to change in the future. Before making any investment decision, investors are recommended to ascertain if this investment is suitable for them in light of their financial knowledge and experience, investment goals and financial situation, or to obtain specific advice from an industry professional.
The value and income of any of the securities or financial instruments mentioned in this document may fall as well as rise and, as a consequence, investors may receive back less than originally invested.
The investment guidelines are internal guidelines which are subject to change at any time and without any notice within the limits of the fund's prospectus. The mentioned financial instruments are provided for illustrative purposes only and shall not be considered as a direct offering, investment recommendation or investment advice. Reference to a specific security is not a recommendation to buy or sell that security. Effective allocations are subject to change and may have changed since the date of the marketing material.
Past performance is not a guarantee or a reliable indicator of future performance. Performance data does not include the commissions and fees charged at the time of subscribing for or redeeming shares.
Any index data referenced herein remains the property of the Data Vendor. Data Vendor Disclaimers are available on assetmanagement.pictet in the “Resources” section of the footer. This document is a marketing communication issued by Pictet Asset Management and is not in scope for any MiFID II/MiFIR requirements specifically related to investment research. This material does not contain sufficient information to support an investment decision and it should not be relied upon by you in evaluating the merits of investing in any products or services offered or distributed by Pictet Asset Management.
Pictet AM has not acquired any rights or license to reproduce the trademarks, logos or images set out in this document except that it holds the rights to use any entity of the Pictet group trademarks. For illustrative purposes only.