I am Article Layout

Now Reading: Barometer: Buying the dip

Select your investor profile:

This content is only for the selected type of investor.

BAROMETER OF FINANCIAL MARKETS february INVESTMENT OUTLOOK

February 2022
Marketing Material

Barometer: Buying the dip

The prospects for equities are encouraging in the wake of a sharp sell-off as global economic growth and corporate profits should remain buoyant.

01

Asset allocation: positioned for a rebound in stocks

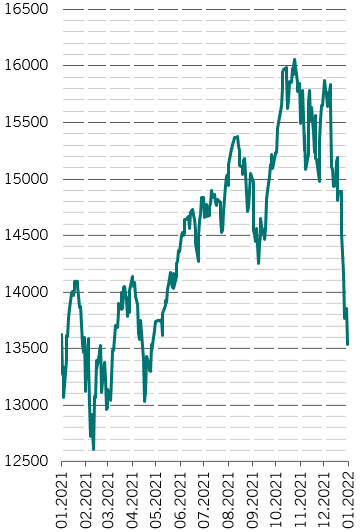
It’s been a gloomy start to the new year. Economic growth has disappointed, Covid cases have spiked and stocks and bonds have sold off sharply. But we believe the world economy and equity markets might be through the worst – at least for the short term.

Following January's rout, we believe that global equities can return around 15 per cent by year-end, thanks largely to a 13 per cent rise in corporate earnings and a steady trickle of dividends. Global bonds, meanwhile, look likely to deliver capital losses. 

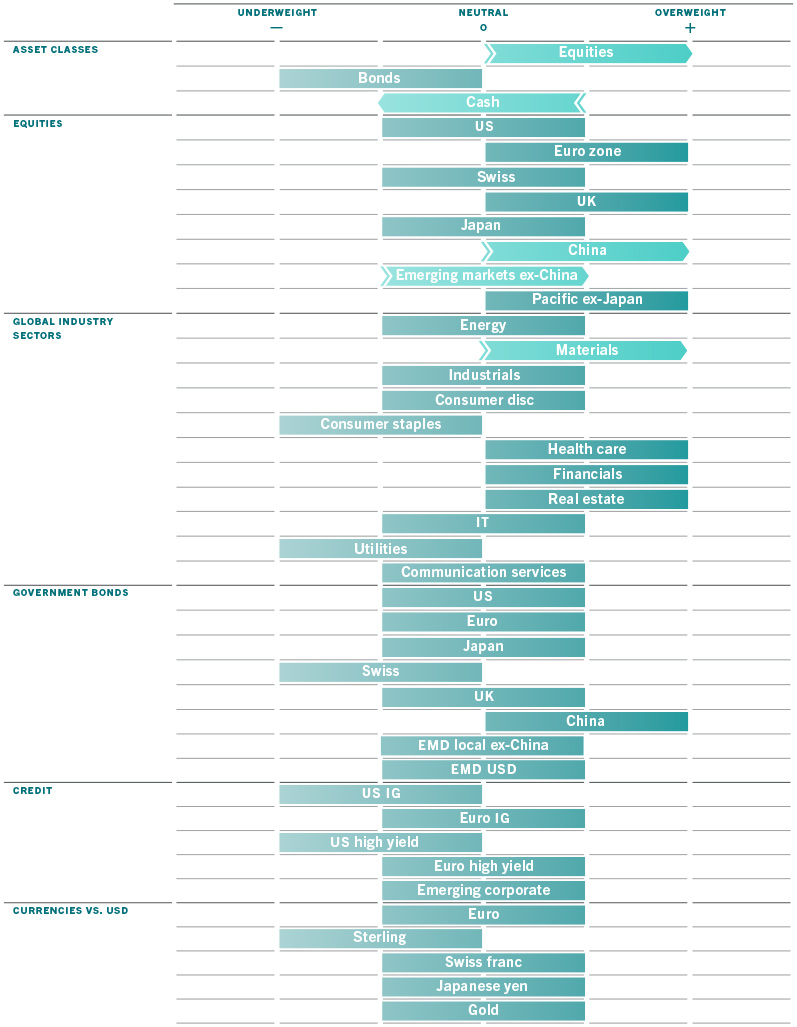
Taking advantage of attractive valuations, we have chosen to upgrade equities to overweight. This is a tactical move, conditional on the speed of US monetary tightening and on a successful resolution of the crisis in Ukraine. Reassuringly, our multi-asset risk appetite indicator – which measures the extent to which the market has been rewarding or penalising historical volatility – remains in positive territory, in contrast to past market corrections. 

Fig. 1 - Monthly asset allocation grid
February
Barometer-February-2022-grid_EN
Source: Pictet Asset Management

Even though recent economic data has been mixed at best, our business cycle indicators suggest the recovery remains intact. Although have reduced our forecast for global growth in 2022 to 4.4 per cent from 4.8 per cent, that projection is still above the 4.2 per cent consensus estimate.1

The negative impact from the Omicron Covid variant should largely be contained to the first quarter of this year and we continue to believe that a return to more normal economic conditions should be the theme for this year – service sectors should reopen and recover to pre-pandemic levels of activity, supply chain constraints should ease and, crucially, price pressures should peak early in the year. 

In the US, we expect inflation to crest in March, which should offer some reassurance to financial assets by reducing the risk of excessive tightening from the US Federal Reserve. Delivery times are shortening and purchasing manager surveys are pointing in the direction of disinflation.

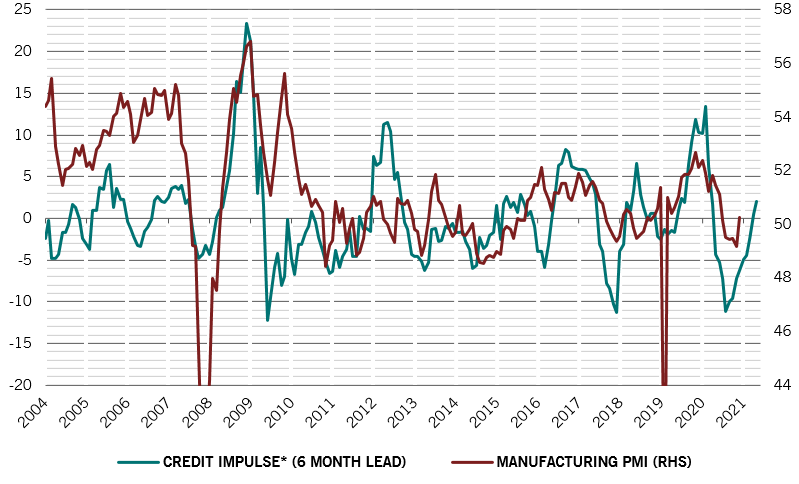
Elsewhere, we see more grounds for optimism in China, where a broad-based recovery is now evident across all sectors.  While our leading indicator is still in negative territory, momentum has improved. The reacceleration in fixed asset investment is particularly strong, especially in manufacturing, and infrastructure spending is picking up as well. Credit conditions are improving, too, and policymakers remain willing to respond to growth concerns.

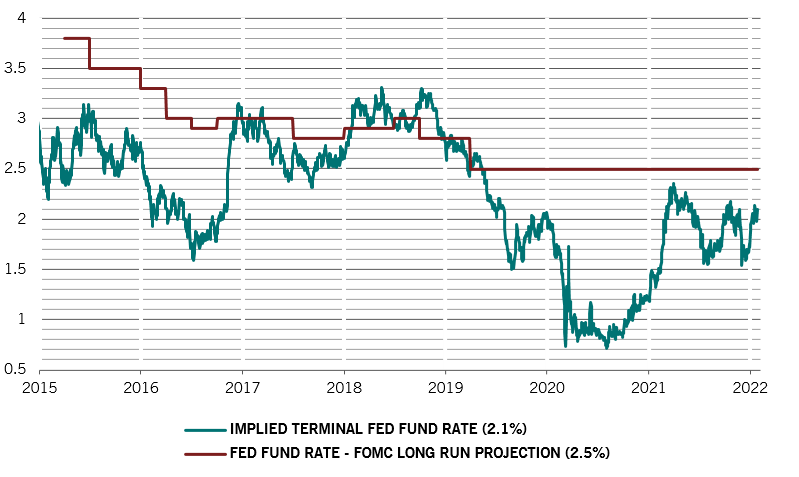
While markets are discounting the prospect of sharp tightening of monetary policy worldwide, our liquidity indicators paint a more balanced picture.

Clearly, our readings have felt the impact of the Fed, which has turned incrementally more hawkish; one FOMC member suggested the central bank could hike rates by 50 basis points in March. The market has already priced in more than four rate hikes for the year. However, there remains uncertainty around the timing, pace and data dependency of quantitative tightening and indeed around the impact it will have on assets.

We are looking at a potential 'quadruple tightening' in the US: an exit from quantitative easing (QE), rate hikes, the start of (QT) and real tightening as inflation recedes. Our liquidity models suggest that the cumulative effect of these moves may result in a 4.5-5 percentage point increase in the US “shadow” real policy rate – which is adjusted for QE and QT policy moves – this year alone.3 To put that in context, the tightening in 2014-19 was 6 percentage points. 

But that tightening is offset by easier conditions elsewhere.

In the private sector, for example, the flow of credit is accelerating and has now reached 10.2 per cent of GDP on a global basis.2

Furthermore, even as some central banks are tightening policy, China continues to move firmly in the other direction. Since December, Chinese authorities have announced a 50 basis point cut in the reserve requirement ratio (RRR), a reduction in lending rates for small and medium-sized enterprises and rural loans and, crucially, a 10 basis point cut in policy rates and a cut in loan reference rates. The rhetoric from various policymakers appears synchronised, pointing towards further easing. 

We will be watching closely, potentially on standby to return to a more cautious stance on equities later in the year if needed. For now, though, global liquidity conditions are broadly neutral for risk assets.

Fig. 2 - Earnings potential
MSCI All Country World index – deviation from 200-day moving average vs earnings momentum
asset allocation - earnings
Source: Refinitiv, MSCI, IBES and Pictet Asset Management. Data covering period 01.01.2016-26.01.2022

Our valuation indicators show that equities as a whole look relatively attractive, exhibiting the best valuation score on our scorecard since March and trading close to fair value. Given the approximate 20 per cent decline in MSCI ACWI’s price-earnings ratios since September 2020 (from 20.7 to 16.7 the pre-pandemic level) our models now suggest no further contraction in earnings multiples till year-end. 

Among sectors, materials and healthcare stocks look particularly attractively valued and even tech is no longer excessively expensive. Chinese equities are well positioned to make up for some of the steep underperformance seen in 2021. China is currently one of the cheapest equity regions, according to our models.

Valuation scores have also improved across fixed income, too.

Technical indicators show poor seasonality trends for bonds; bond funds have seen only muted inflows since the start of the year. In contrast, equity funds have seen inflows of some USD67 billion, despite the recent sell-off. Notably, flows into Chinese stocks have accelerated, chiming in with our more positive stance on its stock market.

02

Equities regions and sectors: Chinese revival in the Year of Tiger

Chinese stocks endured a challenging 2021 as pre-emptive monetary policy tightening and a regulatory crackdown on technology and educational companies triggered an economic slowdown and hit corporate earnings.

However, as the Year of Tiger approaches, their prospects are improving. Leading indicators are picking up as is China’s credit impulse – or the volume of credit flowing into the economy as a proportion of GDP (see Fig. 3).

An increase in that credit gauge is particularly significant as it tends to foreshadow an increase in economic growth.

Fig. 3 - Positive pulse
Manufacturing PMI responds positively to a pick-up in credit impulse
Equities - China credit impulse
* Credit impulse calculated by a six-month change in credit flows as % of GDP (total social financing ex-equity). Manufacturing PMI is an average of NBS and Caixin manufacturing PMI's. Source: Refinitiv, data covering period 01.12.2002 – 01.12.2021

Meanwhile, the People’s Bank of China has shifted its monetary policy stance decisively to easing, supporting the economy with, among other things, cuts to reserve requirement ratios and reductions in both official and loan reference rates.

What’s more, Beijing’s regulatory clampdown last year on its most powerful corporations, which wiped out billions of dollars in value from the stock market, appears to have paused for now.

All of this should allow Chinese equities to recoup losses after last year’s 20 per cent decline and narrow the valuation gap with their counterparts in the coming months.

We also believe Chinese stocks could work as an effective hedge if the Russia-Ukraine crisis escalates into a full-blown military conflict. We therefore upgrade Chinese stocks from neutral to positive.

We are also becoming more optimistic on the prospects for emerging markets more generally. The macroeconomic backdrop is becoming more positive for emerging markets. We’re seeing a divergence in momentum of leading indicators with emerging economies improving at a time when the developed world decelerates further.

Our analysis shows emerging market stocks tend to outperform their developed peers 85 per cent of time when four out of the following five conditions are in place: a falling US dollar, rising bond yields, strong commodities, rising manufacturing output and falling real rates.

The first four conditions will likely be met in the coming months as we think global inflationary pressures will peak in the first quarter, setting the scene for a reacceleration in economic growth.

We expect emerging market companies to deliver earnings growth of more than 15 per cent in 2022, above the global average and more than twice the consensus forecast.1

We also think the dollar – whose appreciation has tended to weigh on emerging market stock returns – is likely to peak in the coming months, given that we see US economic growth lagging that of the rest of the world as the year progresses.

The dollar also tends to depreciate along with the first interest rate hike of the business cycle, which we believe the Fed will deliver in March. We therefore raise our emerging market ex-China to a benchmark weighting.

We do, however, need confirmation on disinflation, stabilisation or improvement in earnings revisions and more clarity on the Ukraine crisis before we turn overweight.

Our more positive view on the Chinese economy means we are also more optimistic on materials stocks, which we upgrade to overweight.

The sector is one of the cheapest on our valuation framework. A weak dollar should also be a boon for material stocks.

03

Fixed income and currencies: hawks in the ascendant

Bond investors are having to negotiate a complex landscape. The Fed’s growing hawkishness in response to rising inflation and signs the US is close to full employment is putting upward pressure on bond yields. This underpins our underweight on fixed income generally. 

But set against that is the risk that the central bank overreacts to inflation at a time when supply constraints are beginning to normalise but new Covid variants and geopolitical tension linger.

According to our valuation models, bonds are approaching fair value – even though yields are still historically low – following their recent selloff. The US 10-year Treasury yield, which hit 1.9 per cent, is neither far from pre-pandemic levels or the 2.5 per cent our models1 suggest is fair value. 

That said, although the market has priced in an aggressive lift-off by the Fed this year, expectations for further rate hikes remain below the central bank’s own projection of long-term policy rates. This leaves scope for some further upside on bond yields over the longer term [See Fig. 4]. So on balance we remain neutral on US Treasury bonds.  

We are more pessimistic on the prospects for US corporate debt, in which we remain underweight; high yield corporate bonds remain particularly expensive with yields at around 300 basis points above Treasuries. 

Fig. 4 - Market not as hawkish as the Fed
US Federal Reserve long run terminal funds rate projection vs market implied projection, percentage points 
FI - Fed vs market terminal rate
Source: Refinitiv, US Federal Reserve, Pictet Asset Management. * 1Y rate in 5 years’ time implied in the US government bond curve. Data from 01.01.2010 to 26.01.2022.

As the dust settles on Fed’s hawkish shift, we believe the US’s economic growth rate will begin to decelerate relative to the rest of the world. This shift should act to slow and eventually halt the US dollar’s appreciation. Precedent strongly suggests the dollar should peak with the first hike in the tightening cycle – which looks to be coming at the Fed’s March meeting. 

The dollar will be a key determinant in how emerging markets perform relative to the developed world. Emerging market central banks were forced by rising inflation and nervous markets to front load their policy tightening, leaving their rates, adjusted for inflation, at some 400 basis points above developed markets. If, as we expect, inflation starts to drop with a relaxation of supply constraints and a stabilisation in oil prices, emerging economies – and their currencies and asset markets – should benefit.

Among emerging market, the recent underperformance of dollar-denominated debt compared to local currency bonds has left the two broadly in balance in terms of valuation.

We remain overweight Chinese government bonds as the country’s policy is increasingly set on a diametrically opposite path to the US’s. The Chinese central bank is turning more accommodative as the Fed stamps on the brakes.

04

Global markets review: New Year rout

Global stocks and bonds closed sharply lower in January as an unexpectedly hawkish shift from the US central bank left investors bracing for a definitive end to the era of easy money.

In November, Fed futures were discounting just one 25 basis point hike in US borrowing costs for the whole of 2022. Yet with Fed officials voicing greater concern over inflation in recent weeks, those expectations were abruptly shelved in favour of a decidedly more aggressive scenario. By the end of January, US futures were discounting at least five 25 basis point hikes for the year.

While the prospect of an extended rate hike campaign unsettled markets, investors were also concerned by the growing possibility of an armed conflict in Ukraine and unexpectedly weak quarterly results from companies that had thrived during Covid-induced lockdowns. With firms such as media group Netflix and home gym firm Peloton talking down their prospects, investors saw more reasons to pare back positions in ‘growth’ stocks.

Fig. 5 - Tech freefall
Nasdaq Composite Index
markets - nasdaq
Source: Refinitiv, Pictet Asset Management. Data covering period 26.01.2021-26.01.2022. 

Growth stocks ended down some 9 per cent in US dollar terms over the month, while ‘value’ stocks – which suffered as countries shut down their economies during the worst of the pandemic - outperformed, losing just 1 per cent.

Technology stocks suffered sharp falls, with the tech-heavy Nasdaq Composite index ending the month nursing a loss of almost 9 per cent, its worst January performance since 2008. The S&P 500 index, meanwhile, was down 5.3 per cent in January – its worst monthly decline since March 2020.

Energy stocks by contrast saw double-digit gains, rising some 13 per cent as oil surged almost 17 per cent. 

Global bond markets ended in the red as US Treasury yields spiked. The yield on the benchmark US 10-year government bond to 1.8 per cent, some 30 basis points higher on the month.

Corporate bonds also sold off. Yields on US high yield bonds rose to above 5.10 per cent, their highest levels since November 2020.


05

In brief

barometer february 2022

Asset allocation

We upgrade global equities to overweight in the face of improved valuations and strong earnings growth prospects.

Equities regions and sectors

We upgrade Chinese and materials stocks to overweight. Our stance on emerging markets ex-China is raised to neutral.

Fixed income and currencies

Our only overweight position in fixed income is in Chinese bonds.