I am Article Layout

Now Reading: Barometer: Unsettling times

Select your investor profile:

This content is only for the selected type of investor.

BAROMETER OF FINANCIAL MARKETS APRIL INVESTMENT OUTLOOK

April 2022
Marketing Material

Barometer: Unsettling times

The lack of a resolution to Russia's invasion of Ukraine, rising bond yields and fresh Covid uncertainty in China encourage caution.

01

Asset Allocation: no spring thaw

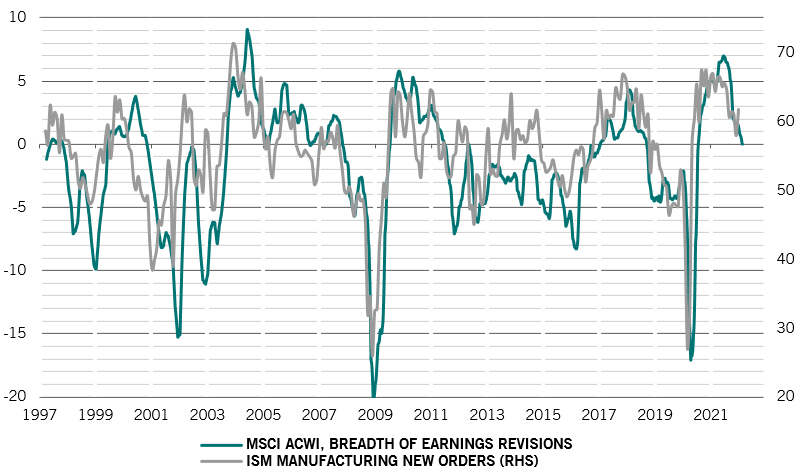
With the Russia-Ukraine war entering its second month, expectations for even slower economic growth and higher inflation are mounting. Given weaker consumer sentiment and persistent volatility in energy prices, the global economy is unlikely to expand as much as initially hoped. While many economies will still grow above trend, we believe risks to corporate earnings are skewed to the downside.

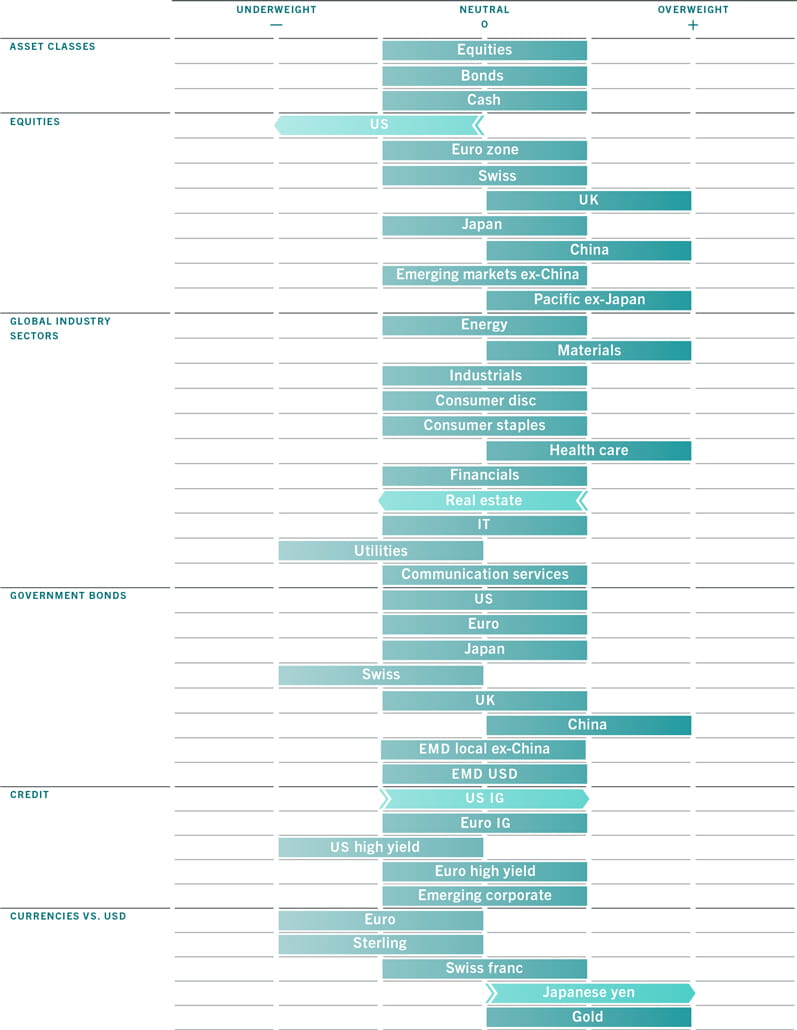
Against this backdrop, we downgrade US equities to negative. A growth-oriented market with the most unattractive valuation in the world, we think US stocks are likely to bear the brunt of the adjustment, with sectors sensitive to interest rates and economic cycles especially under pressure.

That said, we don’t think an outright negative stance on equities is warranted. Investor morale is bouncing off very depressed levels, offsetting deteriorating fundamentals at least in the short term. We therefore remain neutral on equities and bonds. 

Fig. 1 - Monthly asset allocation grid
April 2022
Barometer grid April 2022
Source: Pictet Asset Management

In our analysis of the business cycle, we downgrade our global growth forecast to 3.5 per cent this year from 4.4 per cent; we expect emerging economies and the euro zone to suffer more than other areas, given their proximity to the Ukraine conflict.

Our global inflation forecast this year rises to 7 per cent from 5.1 per cent, although we expect to see a peak in price pressures in the coming few months.That said, the world economy has room to absorb the double shock from higher oil prices and tightening monetary policy.

In the US, energy intensity, which measures the quantity of energy required per unit output or activity, has fallen sharply since the 1970s, while household balance sheets remain healthy with their debt service ratio 4 percentage points below 2008 levels. Other buffers built through the Covid pandemic include excess savings, which stand at 10 per cent of GDP.

We are turning more bearish on the euro zone than the consensus, with our 2022 growth forecast downgraded to 3.2 per cent from 4.1 per cent. Our leading indicators are slipping into territory consistent with recession and are now at their lowest in more than a year. Consumer sentiment indicators are dropping precipitously, which augurs badly for consumption in the coming months.

China’s economy saw some strong momentum following its initial recovery from the pandemic in the fourth quarter. However, a renewed surge in Covid cases and fresh lockdown measures may hurt short-term growth prospects in the world’s second largest economy, eclipsing early signs of a turnaround in construction activity.

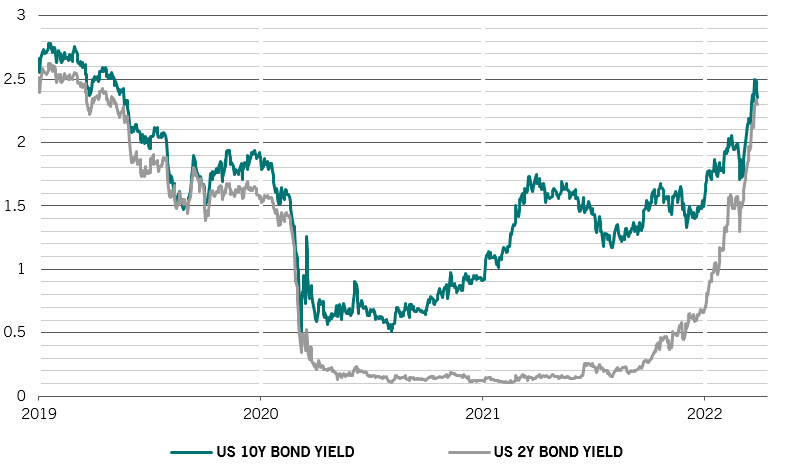
Our liquidity reading continues to deteriorate because of central bank tightening in the US and UK. We think the US Federal Reserve has completed 40 per cent of the tightening we expect it to deliver in this cycle, and should reach 75 per cent by the year end. If anything, investors should be wary of even faster tightening, which will put pressure on the economy. China’s liquidity conditions are improving but the pace of monetary policy easing is slower than the central bank rhetoric suggests.

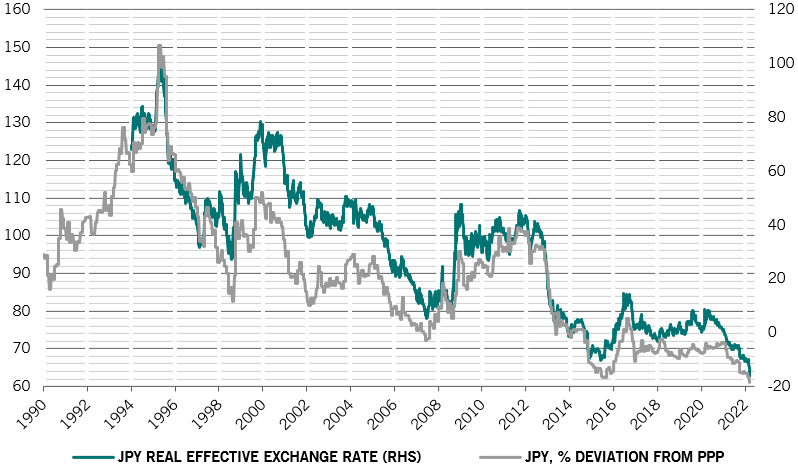
Japan’s liquidity conditions are tightening slightly as the Bank of Japan continues to phase out its ultra-easy monetary policy. The central bank, however, is pledging to defend its yield cap against the global tide of higher interest rates by offering to buy unlimited amounts of 10-year Japanese government bonds. This is leading to a sharp sell-off in the yen (see Fig. 2).

Fig. 2 - Yen appeal
Japanese yen exchange rate relative to purchasing power parity fair value
AA
Source: Refinitiv. Data covering period 16.10.1989 to  28.03.2022.

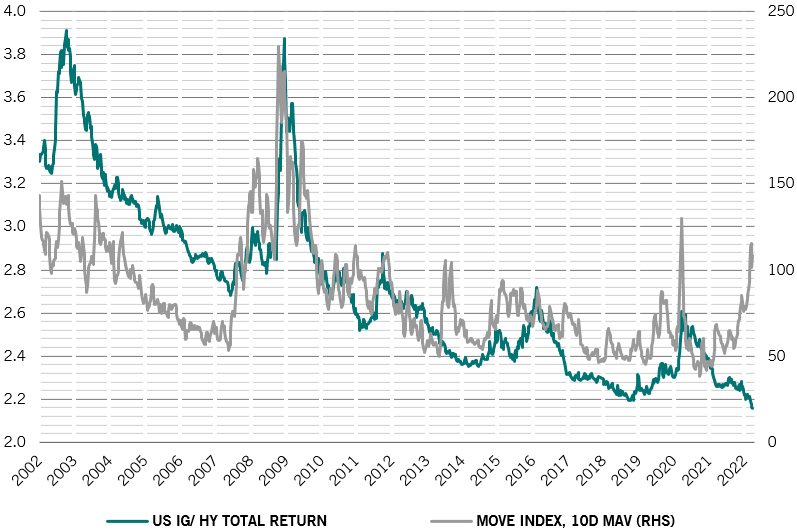
Our valuation indicators for bonds have turned positive after the recent sell-off in major government bonds. Investment grade credit, which is the worst performing major asset class this year, appears oversold and attractive relative to riskier bonds.

The overall score for equities is still negative. With deteriorating liquidity and higher real yields, a further decline in price-to-earnings multiples is possible. In the following 12 months, we expect a contraction of around 5 per cent, which suggests total equity returns could end up flat in 2022 compared with the previous year. That said, pockets of value are opening up in euro zone and Chinese stocks. US and technology stocks remain unattractive from a valuation standpoint.

Technical indicators support our neutral stance for equities. Investor sentiment has bounced off strongly from depressed levels, in line with falling implied volatility in the asset class. A drop in implied volatility below the realised measure makes protection from future sell-offs cheaper. This, in turn, is making it more attractive for investors to take on more risk.

02

Equities regions and sectors: US stocks vulnerable

US stocks have proved remarkably resilient to the economic tremors caused by the conflict raging in Ukraine. They have recovered more quickly from the initial shock of Russia’s invasion than most other developed equity markets, with their returns outpacing those of the MSCI Word Index by some 5 percentage points over the past three weeks. The S&P 500 Index ended the month 5 per cent up, reducing its year-to-date decline to some 6 per cent.

Yet that recovery looks difficult to justify on several counts. To begin with, US corporate earnings are unlikely to rise as sharply as consensus forecasts suggest. Wage increases and higher input costs will squeeze profit margins from the current all-time high of 13 per cent; analyst earnings revisions have already started moving in this direction. We have reduced our earnings growth forecasts for US firms to 9 per cent from 15 per cent at the start of the year, marginally lower than consensus estimates for the first time this cycle.

At the same time, US stocks’ earnings multiples also look lofty. If the Fed is serious in its bid to bear down on inflation, there is fair chance it could speed up the pace of interest rate hikes. In that scenario, the US market’s relatively high exposure to growth stocks becomes a vulnerability. In other words, US stocks’ earnings multiples could contract more sharply than most other markets, bearing the brunt of the global equities’ adjustment to higher interest rates. This, and the fact that US equities are still the most expensive on our scorecard, has led us to downgrade US stocks to underweight from neutral.

Fig. 3 - Signs of slippage
MSCI ACWI earnings revisions (percentage) vs ISM manufacturing new orders
Equities earnings new orders
Source: Refinitiv, Pictet Asset Management. Data from 15.03.1997 to 30.03.2022.

Also looking vulnerable to a correction are real estate stocks, which tend to suffer whenever real interest rates rise. While home prices have remained buoyant, other indicators do not augur well for the sector’s medium term prospects. Mortgage rates in the US have risen sharply, and the average mortgage payment has jumped from USD1,000 in January 2021 to USD1,280 in the same month this year. While the sector is still cheap in relative terms, its valuation is not as compelling as it once was. At the same time, corporate earnings growth estimates for real estate firms are anaemic compared to the other industries and continue to be revised lower. Hence we downgrade the sector to a neutral from overweight.

There are some attractive areas for equity investors, however. One is the UK market. Offering a mix of cheap defensive and commodity-oriented companies, prospects for UK equities look encouraging; we remain overweight. We also believe Chinese stocks are good value and hold a higher-than-benchmark exposure in this market too. While China’s equity markets remain susceptible to shifts in Beijing’s regulatory regime and a possible slowdown in economic growth, valuations have declined to a point where such risks appear fully discounted. Chinese stocks’ earnings multiples are close to their widest ever levels compared to those of their global peers.


03

Fixed income and currencies: a yen for the yen

Given the scale of the recent rout in fixed income markets, valuations for global bonds have turned positive for the first time since early 2011, according to our models. However, we remain neutral on most types of fixed income. It’s too early to call the end of rising yields – central banks from the US to the UK are only just beginning to tighten monetary policy, and soaring inflation may yet force them to be more aggressive than markets currently expect.

Yields on 10-year US Treasuries are now close to our fair value estimate of 2.5 per cent, but a degree of overshoot is plausible. While a peak in inflation is imminent in our view, we still expect more hawkishness from the Fed.

Chinese government bonds – though more expensive – offer better potential in the near term, as China’s central bank remains committed to easing monetary policy to stimulate growth.

In credit markets, we are underweight on US high yield bonds, which continue to see heavy outflows and are likely to be particularly sensitive to a weakening of US economic growth. Worryingly, high yield bond spreads, which tend to move in sympathy with equity market volatility, are lower than the level currently implied by the VIX Index. What’s more, they are not pricing in a significant deterioration in either the economy or financials conditions.

However, we see more room for optimism on US investment grade bonds. Following a steep sell off, they are now the cheapest bonds in development market credit and look oversold compared to the historical trend. Spreads on investment grade credit have risen by around 50 basis points from their lows and we believe value is now emerging. Relative to US equities, meanwhile, investment grade corporate bonds look the cheapest in more than a decade. We have therefore decided to close our underweight stance on the asset class and shift to neutral.

Fig. 4 -  Value in investment grade
Relative total return in US IG versus US HY, and ICE BoFAML US Bond Market Option Volatility Estimate (MOVE) Index 
FI chart - US IG and HY

Source: Refinitiv, ICE Bofa, Pictet Asset Management. Data covering period 01.01.2002 - 29.03.2022.

In currencies, we upgrade the Japanese yen to overweight.

Having been the worst performing major currency so far this year (down some 6 per cent versus the dollar), the yen now trades at an all-time low in real terms and with close to a record 20 per cent discount to purchasing power parity. It is also two standard deviations below its historical trend. Even accounting for the real yield differential with the US – which has deteriorated significantly, in part as a function of the BoJ’s yield curve control policy – we believe the yen is unjustifiably cheap.

Over the long term, the ratio of real GDP (a proxy for demand for yen) to inflation (a proxy for supply) relative to the US would suggest a much stronger yen. There is also the possibility that, faced with yen weakness and reassured by rising inflation, the BoJ may widen its curve control corridor, which would be positive for the currency.

Finally, the yen offers some defensive properties, making it a useful hedge against rising macro and market risks.

To this end, we also retain our overweight stance on gold.

In contrast, we are underweight on the euro. Given the euro zone’s proximity to the conflict raging in Ukraine, and its close economic ties with Russia, the risks to the economy are pronounced and skewed to the downside.

We are also cautious on sterling, not least because of the worsening terms of trade. Britain’s goods trade deficit widened to a record GBP21.9 billion in January.

04

Global markets overview: bonds struggle

Central bankers’ increasing nervousness about inflation’s relentless rise made for a miserable March in the bond markets. Global bonds suffered one of their worst months in memory, down 2.3 per cent in local currency terms. US bonds managed to tread water, benefiting from safe haven status, while European sovereign debt and corporate credit suffered.

Investment grade bond markets were particularly hard hit, with the US down 2.6 per cent, Europe down 1.4 per cent, and emerging market credit down 2.9 per cent. 

Yet equities somehow bucked the pressure, taking comfort in the fact that growth expectations, while slipping, remain positive enough. Global equities gained 2.6 per cent on the month. Meanwhile in China, where markets have been buffeted by a slew of setbacks from Covid to sudden shifts in regulation, investors took comfort from an intervention from senior leadership aimed at improving market sentiment reiterating their pro-growth stance. Nevertheless despite the strong bounce back the market finished the month down 8 per cent. At the other end of the spectrum Japanese equities were up 5 per cent, benefitting from being largely insulated from the geopolitical crisis and from a weak currency – as well as from a history of outperforming during periods of rising real bond yields.

Fig. 5 - Inversion alert
US Treasury bond yields, percentage points
Markets chart - yield curve
Source: Refinitiv, Pictet Asset Management. Data from 01.01.2019 to 30.03.2022.

Once again, commodities were the stars, with oil up another 6 per cent on the month, albeit with considerable volatility as markets digested the impact of Western sanctions on Russia and of the US’s announcement of a record release from strategic petroleum reserves. Energy stocks were the equity market’s performers, followed closely by materials. Non-oil commodities were even stronger, gaining nearly 10 per cent on the month – Ukraine and Russia are major producers of wheat and edible oils, while Russia is a source of key industrial metals, not least those that play a key role in the green transition, like nickel.

In the currency markets, the rouble recovered strongly from its sharp decline the previous month as investors played down concerns about worst case scenarios of the ongoing conflict. The Russian government’s demand that ‘hostile’ countries have to pay for Russian gas in roubles, potentially undermining the effects of some of the sanction efforts, also helped. The Japanese yen was a big loser, as the central bank’s a commitment to keep bond yields capped is increasingly at odds with the Fed’s stance.

Notwithstanding the rebound in equities during the month, the first quarter was miserable for both risky and ‘safe’ assets. Both global equities and bonds were down nearly 5 per cent in local currency terms. The risks to the longer term economic outlook are highlighted in the flattening and inversion of the yield curve as the gap between the US 2- and 10-year yields collapsed (see Fig. 5). The only standout winners were commodities, with both oil and the wider complex up by a third or more since the start of the year.

05

In brief

Barometer april 2022

Asset allocation

With no signs of the energy crisis letting up or a resolution to Russia's invasion of Ukraine, we maintain a neutral position on equities and bonds.

Equities regions and sectors

Rising bond yields, expensive valuations and weakening fundamentals lead us to reduce US equities to underweight from neutral and to cut real estate to neutral from overweight.

Fixed income and currencies

We upgrade the Japanese yen to overweight, thanks to attractive valuations. We also turn less negative on US investment grade bonds.