Private Equity, an advantage for sustainable economic transition
Private equity is entering the growing economic sectors. Considered by some as a speculative investment and by others as a diversification tool, this asset class continues to make headlines.
Written by

Pierre Stadler
Head of Thematics - Private Equity
Why should private equity outperform public equities?
Private equity (“PE”) has now established itself as a major and mature asset class and has increasingly become a key component in the asset allocation of institutional and private investors alike. Investing in private companies offers a myriad of benefits, and this article will aim at providing a few hypothesizes of the key drivers of private equity outperformance, an overview of the returns to be expected from a diversified PE portfolio and offer a suggested framework for portfolio construction. As more and more investors are considering to build portfolios with dual objectives (financial and non-financial), we will discuss an emerging theme of investing in funds and companies that focus on promoting environmental objectives, using the Planetary Boundary framework of impact evaluation.We will discuss an emerging theme of investing in funds and companies that focus on promoting environmental objectives
PE fund managers can also generate meaningful synergies across their portfolios, and an increasing number of fund managers have decided to specialize their competencies around specific sectors where they have developed most expertise.
Another major driver for better alignment lies in the longer investment horizons imposed by PE investors. Private investors, in particular VC fund managers, can support loss making companies over several years, therefore enabling them to prioritize on product development, which in turn generates a higher degree of innovation. Companies under private equity ownership can have a longer term vision for implementing their strategic initiatives as they do not face the same stakeholder pressure to meet and beat quarterly earnings forecasts.

Does private equity over-perform its public equity peers?
Most alternative asset classes will require a specific set of performance measurement tools. PE is no exception and there are usually three performance indicators that are most commonly used. The total value to paid-in ratio, or tvpi, will sum the distributions received to the residual value of any investment and divide it by invested capital. The dpi ratio, or distributed to paid-in, will measure the level of “realization” of any investment, and divide the amount of distributions received by the amount of invested capital. The dpi indicates how close below or above payback (dpi = 1.0x) any specific PE investment currently stands. Finally, the internal rate of return (IRR) as a money-weighted performance measure, is most adapted to PE investment, as the timing and amplitude of cashflows need to be taken into account to judge a fund manager’s performance.
Comparing returns of PE fund investments with those of traditional asset classes has always required academics to adapt either side of the asset class measurement toolkit to fit the other to allow for such comparison. As a result, many hypotheses need to be taken in these exercises and any private vs. public performance analysis can arguably be criticized. One of such approaches is the public market equivalent (“PME”) method. It does have several advantages and has become commonly accepted by industry experts despite some of its limitations. As PE fund investors do not control the timing of the cashflows (capital calls and distributions), the principle is to replicate those cashflows on an equivalent public market index in order to assume identical entry and exit points. This means that for every PE capital call a number of shares of the public stock index will be purchased and for every PE distribution a pro-rata amount of shares will be sold. This methodology allows for an IRR calculation of all cashflows which can then serve as a common ground for performance comparison between private and public indices.
Vintage year performance
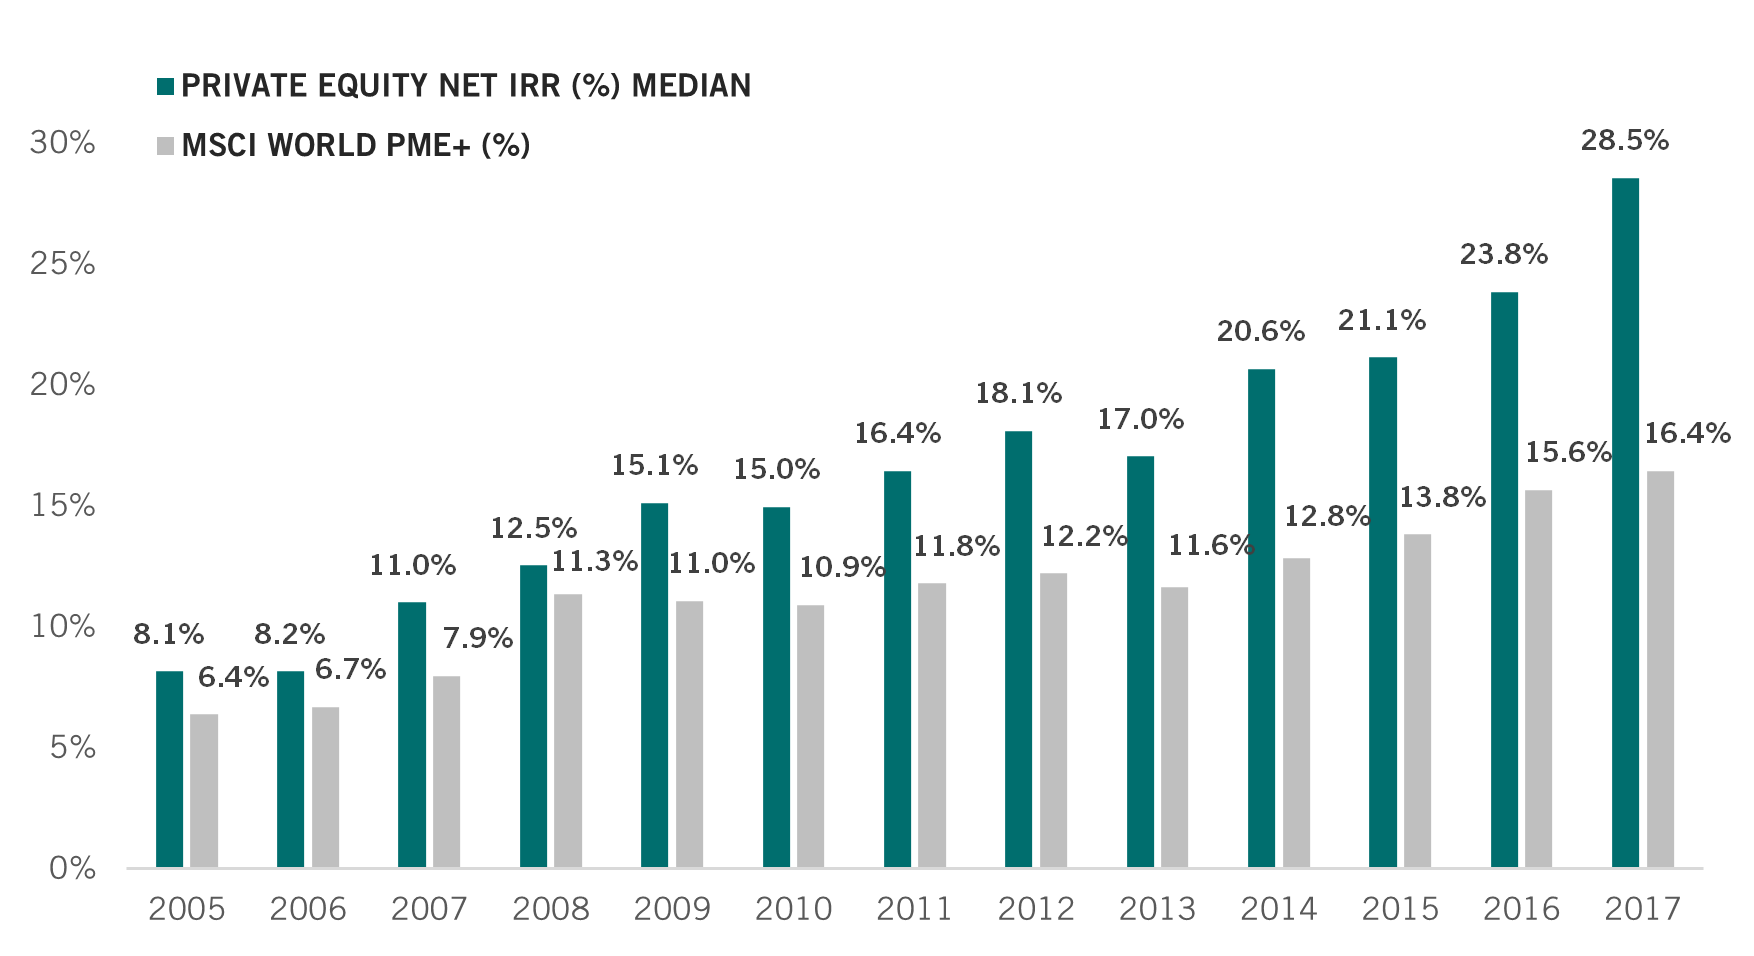
Applying the PME methodology to long term median returns of private equity shows a persistent and long term overperformance of the asset class. The private equity portfolio beats the public market equivalent in every single year reviewed below. Most recent vintage years are excluded from the analysis below as it typically takes 3-4 years for PE performance to become meaningful. It has to be mentioned that although the analysis indicates persistent overperformance of the asset class, applying proper selection remains key when investing in private equity as the dispersion of returns is extremely high among fund managers (the spread between the bottom quartile vs. the top quartile performers).
What allocation to consider within a global portfolio?
Modern portfolio theory oftentimes comes short when trying to determine and optimize precise PE portfolio allocations. As discussed, the specific performance measures that apply to PE investments make it difficult to determine allocation targets for alternative PE investments within portfolios of traditional assets. A pragmatic approach suggests to search for empirical evidence of allocations to private equity (including venture capital) across US endowment funds. The National Association of Colleges and Universities Business Officers (NACUBO) has published a recent study showing that overall, US Institutions allocate 27.2% of their assets to private equity. Unsurprisingly, the study shows a strong correlation of allocation percentages and assets under management.US Institutions allocate 27.2% of their assets to private equity.
In traditional 60/40 portfolio construction frameworks, we would suggest to consider PE within an overall equity allocation, as it will fundamentally bear a similar economic risk when compared to traditional equity investments. PE backed companies may bear additional structural risks, in particular when looking at leveraged buyout transactions which may be seen as having riskier balance sheet structures in comparison to traditional equity investments. We believe that the illiquidity inherently linked to PE investments should not be considered as a factor of risk (as it is not directly quantifiable), it should however be included in shortfall analyses and in stress case scenarios.
Proper portfolio construction is paramount when planning for a PE allocation. Understanding the patterns and the maturity of expected cashflows is required to calibrate the proper level of fund commitments to enter in in order to reach a desired level of exposure to the asset class (as measured by net asset value and not by commitment). The ultimate goal for the portfolio construction should be for a mature portfolio of PE assets to be self-financing and cash yielding. Such goal can only be reached with constant exposure to the asset class, thus by continuously committing capital to the asset class over several cycles (or vintage years).
Thematic PE investing: an example of environmental investing by applying the planetary boundaries framework
Asset managers worldwide are increasingly looking to integrate a supplemental, non-financial, dimension to their monetary performance objectives. These can be expressed with various forms of commitments towards any societal, environmental or even philanthropic goal. On the supply side, fund managers have been quick to provide solutions to fulfil these objectives, and a myriad of “sustainable”, “impact”, “responsible”, or “net zero” strategies have emerged.
There is currently no consensus on the various Environmental, Social and Governance (“ESG”) frameworks to apply, and some investors are hoping for regulators to step in to provide clarity. The EU Commission’s Sustainable Financial Disclosure Requirements (SFDR) is an example of such, albeit at its early debuts. The disclosure framework suggested by the EU is evidently lacking the needed pragmatism that asset managers require for implementing a “twin purpose” investment approach, i.e. integrating one or several ESG components in their investment approach and ultimately achieving financial and non-financial goals.

2Extinctions per Million Species-Years (E/MSY). Source: Stockholm Resilience Center, Pictet Asset Management, May 2022
One useful framework that considers mainly the “E” of the ESG equation is Planetary Boundaries. The planetary boundaries framework defines a “safe operating space” for humanity based on the intrinsic biophysical processes that regulate the stability of the Earth system. This framework relates to nine global environmental dimensions, and their respective boundaries within their respective safe operating spaces. Four of the nine planetary boundaries — biodiversity loss, biogeochemical flows, climate change and land-system change — have now been breached. To avoid breaching further any of these boundaries, we must understand how to adapt our capital allocations to this new reality.
The framework uses several objective criteria such as concentrations of greenhouse gases, or biodiversity loss. It then attempts to establish how far each of these can change without risking to cause irreversible damage to the environment. Pictet has developed a proprietary model that quantifies the environmental impact for every USD 1m of annual revenue businesses generate within the framework of Planetary Boundaries. If a company’s activities lie within the safe levels of operation for each of the nine dimensions over the whole of the product value chain, then the firm can be viewed as being environmentally sustainable; if not, then the company is contributing to the global environmental degradation.
We believe this framework helps solving the major issue of data collection by allowing to better track the environment sustainability of companies. It helps to highlight those that actively make a contribution to solving environmental problems and help others to become aware and potentially to reduce their environmental footprint.
Investing in private equity is investing in the real economy and in companies that shape our world every day. As a long-term asset class, fundamental and sustainable value creation lies at the core of the superior return generation for fund managers of PE and VC funds. The incentive mechanisms for investors and managers are a catalyst for innovation and for strong returns. PE investors can support shaping new trends and participating in next generation economies by allocating capital to thematic oriented funds. These specialized funds focus their investment universe around segments of high conviction. More recently, there has been an emergence of sustainable and impact focused strategies that do not necessarily compromise on return expectations but have a dual objective of offering financial and non-financial goals to their investors.
Important legal information
This marketing material is issued by Pictet Asset Management (Europe) S.A.. It is neither directed to, nor intended for distribution or use by, any person or entity who is a citizen or resident of, or domiciled or located in, any locality, state, country or jurisdiction where such distribution, publication, availability or use would be contrary to law or regulation. The latest version of the fund‘s prospectus, Pre-Contractual Template (PCT) when applicable, Key Information Document (KID), annual and semi-annual reports must be read before investing. They are available free of charge in English on www.assetmanagement.pictet or in paper copy at Pictet Asset Management (Europe) S.A., 6B, rue du Fort Niedergruenewald, L-2226 Luxembourg, or at the office of the fund local agent, distributor or centralizing agent if any.
The KID is also available in the local language of each country where the compartment is registered. The prospectus, the PCT when applicable, and the annual and semi-annual reports may also be available in other languages, please refer to the website for other available languages. Only the latest version of these documents may be relied upon as the basis for investment decisions.
The summary of investor rights (in English and in the different languages of our website) is available here and at www.assetmanagement.pictet under the heading "Resources", at the bottom of the page.
The list of countries where the fund is registered can be obtained at all times from Pictet Asset Management (Europe) S.A., which may decide to terminate the arrangements made for the marketing of the fund or compartments of the fund in any given country.
The information and data presented in this document are not to be considered as an offer or solicitation to buy, sell or subscribe to any securities or financial instruments or services.
Information, opinions and estimates contained in this document reflect a judgment at the original date of publication and are subject to change without notice. The management company has not taken any steps to ensure that the securities referred to in this document are suitable for any particular investor and this document is not to be relied upon in substitution for the exercise of independent judgment. Tax treatment depends on the individual circumstances of each investor and may be subject to change in the future. Before making any investment decision, investors are recommended to ascertain if this investment is suitable for them in light of their financial knowledge and experience, investment goals and financial situation, or to obtain specific advice from an industry professional.
The value and income of any of the securities or financial instruments mentioned in this document may fall as well as rise and, as a consequence, investors may receive back less than originally invested.
The investment guidelines are internal guidelines which are subject to change at any time and without any notice within the limits of the fund's prospectus. The mentioned financial instruments are provided for illustrative purposes only and shall not be considered as a direct offering, investment recommendation or investment advice. Reference to a specific security is not a recommendation to buy or sell that security. Effective allocations are subject to change and may have changed since the date of the marketing material.
Past performance is not a guarantee or a reliable indicator of future performance. Performance data does not include the commissions and fees charged at the time of subscribing for or redeeming shares.
Any index data referenced herein remains the property of the Data Vendor. Data Vendor Disclaimers are available on assetmanagement.pictet in the “Resources” section of the footer. This document is a marketing communication issued by Pictet Asset Management and is not in scope for any MiFID II/MiFIR requirements specifically related to investment research. This material does not contain sufficient information to support an investment decision and it should not be relied upon by you in evaluating the merits of investing in any products or services offered or distributed by Pictet Asset Management.
Pictet AM has not acquired any rights or license to reproduce the trademarks, logos or images set out in this document except that it holds the rights to use any entity of the Pictet group trademarks. For illustrative purposes only.