Danica May Camacho was born on October 30, 2011, to the sort of fanfare rarely seen in Manila’s crowded public hospitals.
That’s because she represented a global milestone – her birth brought the world’s population to seven billion.
It was at once a joyful occasion and a reminder of the challenges posed by ever more people competing for finite resources.
In less than 30 years’ time, the planet will be home to nine billion human beings, a larger proportion of which are likely to be part of the urban middle class.
This is certain to put even more pressure on the environment, testing it to breaking point.
Investors are increasingly alert to these challenges.
Many now recognise that, as stewards of capital, they have a crucial role to play in placing the economy on a more sustainable footing. But for them to become part of the solution, investors need to resolve a paradox.
How can they become responsible guardians of the environment and simultaneously secure an attractive return on their investments?
We believe the solution to that conundrum has already begun to take shape. With governments and businesses responding to growing public pressure to reverse ecological degradation, a distinct and attractive group of environmental equity investments has emerged.
These are companies that combine strong environmental credentials with innovative products and services designed to safeguard the world’s natural resources.
Such firms form the core of our Global Environmental Opportunities (GEO) portfolio.
02
A burgeoning environmental products industry
Public shaping the agenda
Once a niche activity, environmental investing is now moving firmly into the mainstream. There are several reasons for that.
To begin with, society’s attitudes towards protecting the planet have changed considerably in recent years.
That's partly because a growing proportion of the population has personal experience of the damage ecological degradation can cause. In 2015, pollution killed nine million people – three times more than AIDS, tuberculosis and malaria combined.1 Floods and droughts have brought untold misery to millions more.
Social media has also helped shape world opinion. Thanks to platforms such as Twitter and Facebook, people can now voice and share their concerns about pollution and sustainability in a way they couldn’t before.
People power has, in turn, brought about a change in government priorities. China is a striking example of this trend.
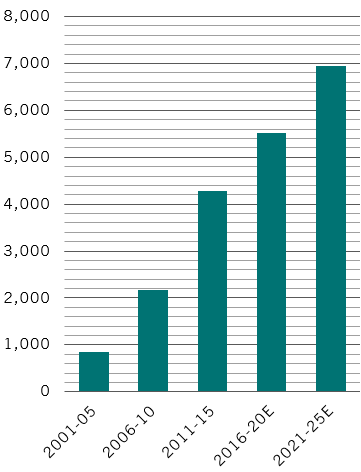
Fig. 1 how to spend it
Growth in China's environmental spending (in RMB bln)
Source: National Bureau of Statistics of China, Pictet Asset Management
In the run-up to the 2008 Olympics, the US embassy in Beijing started tweeting hourly air quality data from its roof-top monitor.
This was the first time the public had access to live data on airborne particles known as PM2.5, which kill more than 4 million people worldwide a year.
As a result, local residents began voicing their concerns about air quality, eventually taking to the streets to stage large public demonstrations.2
In response to growing social discontent, China’s leadership unveiled a ground-breaking action plan in 2013 to tackle “Airpocalypse” with investments worth hundreds of billions of dollars and a slew of regulations.
China's Premier Xi Jinping has named environmental degradation as one of the three main battles the country has to fight along with political and financial risks and poverty alleviation, adding that: "We will never again seek economic growth at the cost of the environment."
China’s investment in the environment has in fact risen seven-fold since the early 2000s (see chart).
But this is unlikely to be the end of its spending boom. Beijing has promised to invest even more heavily in advanced environmental science and technology.
Also giving sustainable investing a shot in the arm is a sharp drop in the cost of technologies such as renewable energy, water recycling and agri-tech. In the US, wind power is now cheaper than any other form of energy, having seen a 40 per cent drop in production costs over the past decade. The costs of producing utility-scale solar power have declined by more than 60 per cent over the same period.
Stars aligned for environmental industry
The combination of people power, government policies and economics has given rise to a thriving – and eminently investable – industry for environmental products and services.
China's generously-funded anti-pollution drive, for example, is likely to boost the prospects of firms that develop environmental technologies such as filters for engines and industrial applications for pollution control.
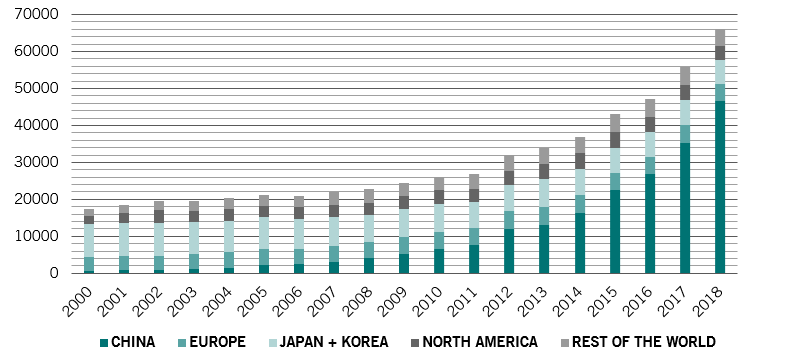
More broadly, as corporations worldwide embrace sustainable business practices, publicly-listed firms specialising in the development of a broad range of environmental technologies have mushroomed, while the number of patents filed for environmental products over the past decade has more than tripled.
Fig. 2 becoming innovative
Environmental technology patent publications by filing country
Source: WIPO Database, data as of 31.10.2019
The economic benefits – and investment potential – manifest themselves in several ways:
Precision agriculture: A GPS guidance system can save a farm of 1,000 acres about USD13,000 in variable costs annually, paying for itself within one year. Even if only 10 per cent of US farmers use GPS for planting seeds, it could save 16 million gallons of fuel, four million pounds of insecticide, and two million quarts of herbicide per year.3
Renewable energy: Renewable energy usage has been growing rapidly thanks to falling production costs. Being bid at less than USD0.02 per kilowatt hour, solar power will soon be cheaper than any form of fossil fuel-based power generation.4 The cost of electricity from offshore wind farms, once one of the most expensive forms of green energy, is expected to drop by some 70 per cent over the next two decades.5
Smart cities: Installing a suite of connected infrastructure such as water, electricity and waste, or upgrading ageing systems should cut bills and improve resource management. Barcelona, for example, saves USD58 million annually with smart water technology that uses connected sensors and cloud servers to monitor irrigation and water levels.6
Energy efficiency: Investing in electric public transport, using more renewable energy and increasing efficiency in commercial buildings and municipal waste management could cut energy costs by about USD17 trillion worldwide by 2050.7
Pollution control: Pollution mitigation and prevention can yield large net gains for the economy. In the US, an estimated USD30 in benefits has been returned to the economy for every dollar invested in air pollution control since 1970.8 More specifically, we see strong growth for companies developing technologies such as filters for engines and industrial applications for pollution control.
Critical mass
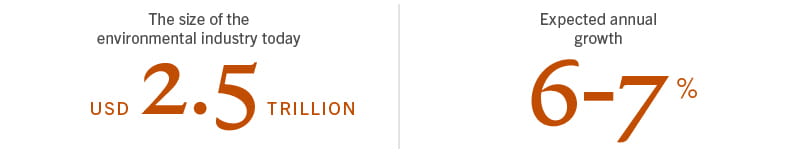
Fig. 3 environmental industry in numbers
Source: Pictet Asset Management
Overall, we estimate that the environmental products industry is already worth some USD2.5 trillion, and can grow by about 6-7 per cent per year.
That should matter to investors: sales growth of companies operating in this sector should outpace that of firms in the MSCI All-Country World equity index.
[1] The Lancet Commission on pollution and health, 19.10.2017
[2] According to the Chinese Academy of Social Sciences/South China Morning Post, as many as half of public protests in China involving at least 10,000 participants in 2000-2013 stemmed from concerns about pollution
[3] USDA, https://link.springer.com/article/10.1186/2192-0567-2-22
[4] Bloomberg
[5] Bloomberg New Energy Finance
[6] See document
[7] The Global Commission of the Economy and Climate
[8] Lancet Commission on pollution and health, 19.10.2017
03
A process to unlock the potential of environmental investments
When it comes to investing in rapidly-evolving industries such as environmental technology, identifying the most promising opportunities isn’t straightforward.
That is why investment managers of our GEO strategy have developed a process that deploys both a scientific, rule-based framework and traditional company-by-company research to build their portfolio.
Central to the investment process is a ground-breaking scientific model called Planetary Boundaries (PB).
This is a model developed in 2009 by a team of leading scientists at the Stockholm Resilience Centre (SRC) and other leading environmental organisations.
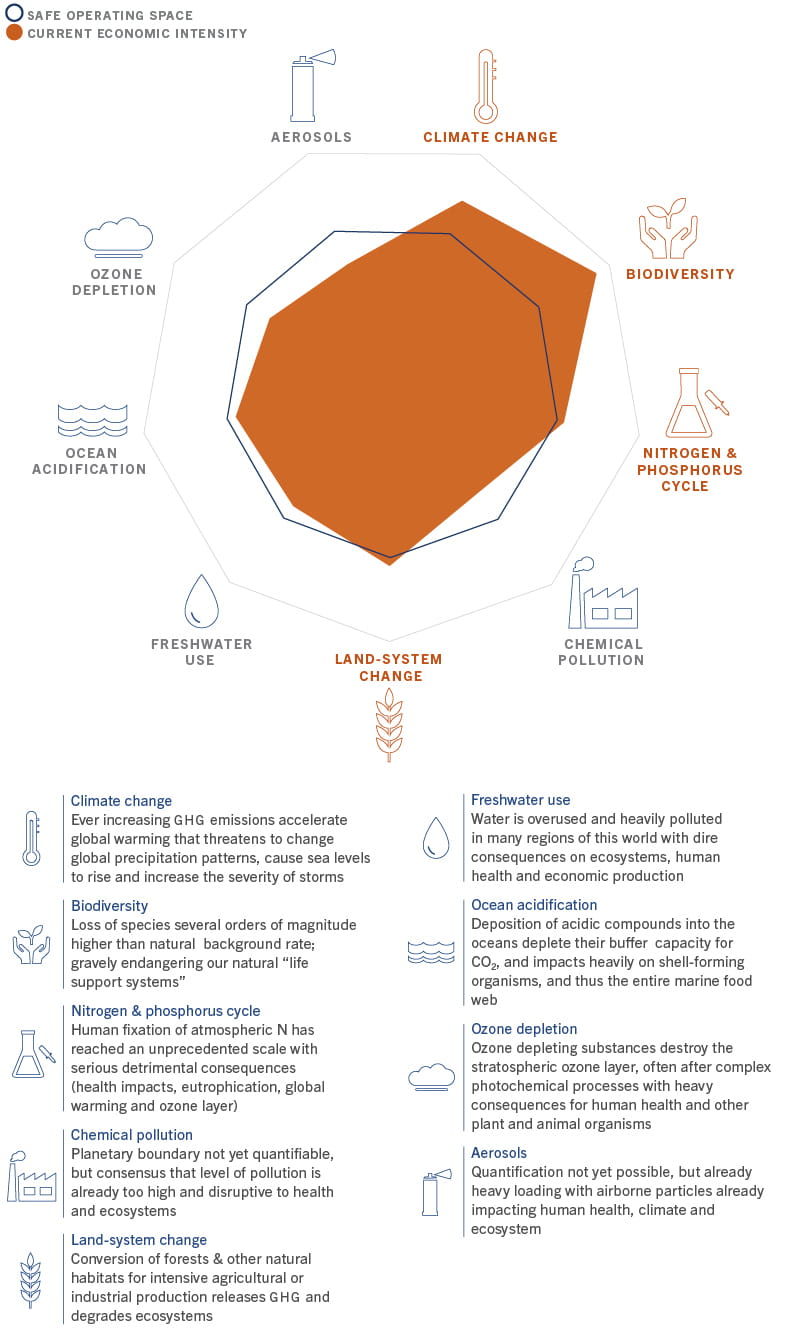
The PB framework identifies the nine most critical environmental dimensions - including carbon emissions (climate change), fresh water, land use and biodiversity - that are essential to maintaining a stable biosphere. What makes it particularly useful for investors is that it quantifies the safe operating space within which human activities should take place.
The model states, for example, that for global water use to remain at sustainable levels, humans must not draw on more than 6 million cubic metres a year. Breach that, or any of the other eight thresholds, the model says, and the risk of triggering abrupt or irreversible damage to the Earth’s biophysical systems increases significantly.
As Fig. 4 shows, four of the nine boundaries have been transgressed.
Fig. 4 planetary boundaries
Source: Stockholm Resilience Centre, Pictet Asset Management, data as of 31.03.2020
Working with the SRC, PictetAM has adapted the PB model in a way that enables our investment managers to measure the environmental footprint of every one of the 100 plus industries within the MSCI equity index - along each of the nine dimensions.
The framework we have devised quantifies the resource usage and pollution emissions expressed as a unit per USD1 million of annual revenue.1
In performing this calculation, we analyse every activity in the production of a good or service: the extraction of raw materials, manufacturing processes, distribution and transport, product use, and disposal and recycling.2
Using this lens, we are able to rank industries according to the size of their environmental footprints. Our audit of the fashion industry demonstrates how the model works. According to our framework, for an industry to qualify as a sustainable user of water, it must not use more than 81,000 cubic metres per USD1 million of revenue. Applying this to the fashion industry, we find that the sector uses more than four times that amount. In other words, fashion fails on the water use metric.
The framework can also be applied to more complex environmental problems such as biodiversity loss.
For changes in biodiversity to remain at normal levels, the model states that the annual animal and plant extinction rate must be less than 0.13 per million species for every USD1 trillion of revenue generated. Applying this framework to the constituents of MSCI All-Country World Index – which together made more than USD30 trillion in revenue last year – we find that the world's biggest corporations are killing off animal and plant species at a rate that is 22 times greater than the threshold level.
A worrying statistic, yet the model can also be used to identify the industries that protect biodiversity.
Our analysis shows that the biodiversity footprint of industries such as environmental engineering and consulting, as well as water sewage networks, are negative -- meaning that products and services provided by these groups of companies help restore biodiversity.
Identifying environmental specialists
By repeating these calculations industry by industry, and boundary by boundary, we are able to narrow our investment universe to some 3,500 companies.3
In the next phase of the process, we take a deeper look at the core business of each company that is identified in step one.
Here, our goal is to determine which firms are developing products and services that make a real difference in reversing environmental degradation.
We only select companies whose products or services make a positive impact on at least one environmental dimension in the PB model.
For each company we assign a proprietary “thematic purity” value, which indicates what proportion of a firm’s enterprise value (EV), revenue or EBITDA is derived from environmental products and services.
For a company to qualify for inclusion in the portfolio, its purity value must be at least 20 per cent.4
These filters narrow down our investment universe to about 400 companies.
In the next step, we conduct detailed company-by-company research to identify firms with the most attractive risk-return characteristics.
We use a proprietary scoring system, which takes into account the strength of the business model, management quality, valuation and operational momentum metrics. ESG analysis is systematically integrated in this stage as well.
The result is a concentrated portfolio of around 50 stocks - each investment combining an attractive risk-return profile with a small ecological footprint.
But our investment process does not end there.
Our aim is to be an active owner of the companies we invest in.
For this, we exercise voting rights through a proxy voting platform and engage with the companies to ensure they have the best possible governance structure in place.
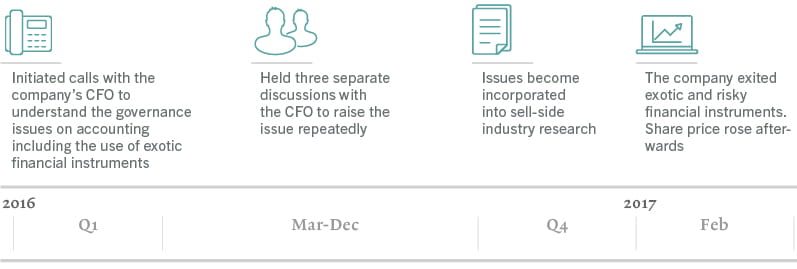
Fig. 5 actively engaging
Example of how we've engaged with a UK-based environmental utility company
Source: Pictet Asset Management
[1] Butz, C., Liechti, J., Bodin, J. et al. Towards defining an environmental investment universe within planetary boundaries. Sustain Sci 13, 1031–1044 (2018). https://doi.org/10.1007/s11625-018-0574-1
[2] We use Carnegie Mellon University’s Economic Input-Output Life Cycle Assessment (EIO-LCA) database to quantify the environmental impact of 150-plus corporate sub-industries, defined by Bloomberg with its Global Industry Classification Standard methodology. For more, see http://www.eiolca.net/ and https://data.bloomberglp.com/professional/sites/10/Classification-Data-Fact-Sheet.pdf
[3] We remove companies that are on our “black list” – consisting of companies commercialising controversial weapons, such as anti-personnel mines, chemical or cluster munitions from the investment universe
[4] The portfolio has an average purity score of at least 60 per cent
04
Making a demonstrable impact
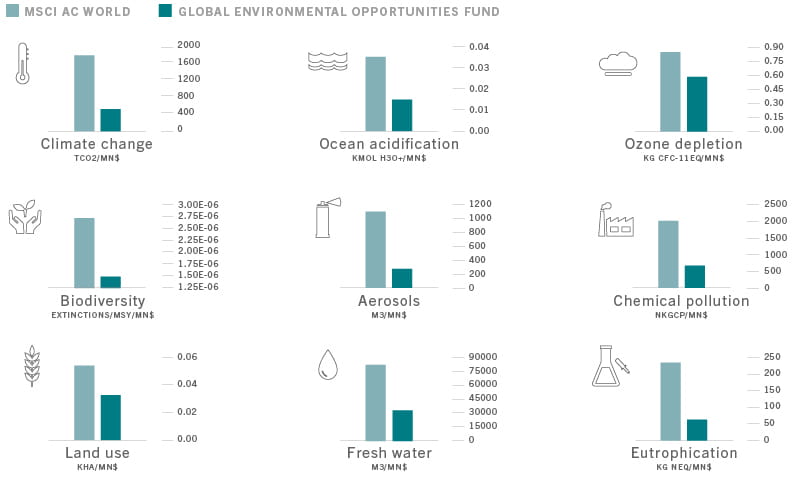
The Global Environmental Opportunities portfolio achieves a significantly more positive environmental impact than that of a typical global equity strategy across all nine dimensions, particularly in climate change (see Fig. 6).
Fig. 6 positive impact
Using the Planetary Boundaries framework to compare Pictet Global Environmental Opportunities strategy to MSCI ACWI
For example, carbon dioxide emissions of companies in our portfolio stand at 454 tonnes of CO2 equivalent per million dollar of annual revenue (tCO2 eq/mn$), compared with 1,948 tonnes for the MSCI AC World index.
This is one of the many positive impacts investors can make with this strategy to protect the planet.
As stewards of global capital, investors matter. And in two ways.
On one hand, investors can provide vital funding to the companies developing products and services that can reverse ecological damage.
On the other, they alone have the power to withhold or withdraw capital from businesses that fail to take their environmental responsibilities seriously.
For investors, the opportunity to bring about change has never been greater.
Many investors have long appreciated the need to protect the planet. But they have not always been convinced sustainable investment was financially viable.
Thanks to the emergence of thriving environmental products industry, the calculus is now changing.Investing to safeguard the natural world does not mean sacrificing returns. It can enhance them.
05
Case study: analysing industries' impact on biodiversity
Our model, based on the Planetary Boundaries (PB) framework, shows that the threshold for biodiversity loss for any industry, across its entire production chain, is 1.3 x 0.0000001 extinctions per one million species per year (MSY) per USD1 million of annual revenue.
Environmental engineering and consulting
The PB model shows that business activity of companies which provide specialised consulting and technical services in environmental and resource management actually improves biodiversity.
The industry’s biodiversity footprint stands at a negative 1.27 x 0.000001 extinctions/MSY per USD1 million of annual revenue. This means products and services provided by this group of companies help restore biodiversity.
In fact, the environmental engineering industry has a positive environmental footprint across all the nine PB dimensions, particularly in terms of promoting biodiversity and combatting global warming.
Water sewage networks
Companies operating in this industry provide specialised technologies and utility services on water sewage networks. The PB model shows the industry’s biodiversity footprint stands at minus 1.11 x 0.000001 extinctions/MSY per USD1 million of annual revenue. The water sewage networks industry has positive PB scores across the nine boundaries, with the exception of global warming.
Luciano Diana joined Pictet Asset Management in 2009 and is a Senior Investment Manager in the Thematic Equities team.
He has been co-managing the Global Environmental Opportunities strategy since its inception in 2014. Prior to that Luciano co-managed the Pictet Clean Energy Strategy from 2009-2016. Before joining Pictet, Luciano spent four years at Morgan Stanley, where he headed the London based clean energy sell-side research team. He began his career in 1998 as an IT strategy consultant at Accenture.
Luciano holds a Laurea in Telecommunications Engineering from the University of Padua, Italy, and he was a Visiting Scholar at the University of California at Berkeley. He holds an MBA from INSEAD.
About
Marc-Olivier Buffle
Marc-Olivier Buffle joined Pictet Asset Management in 2014 and is Head of Thematic Client Portfolio Managers and Research in the Thematic Equities team, an internal member of Global Environmental Opportunity’s advisory board and of Pictet’s Environmental Policy Committee.
Prior to that Marc was a member of the Board of the Swiss Climate foundation and of Pictet’s Sustainability Board. Before joining Pictet, Marc was at RobecoSAM where he acted as Head of industrials and water equity research, as well as co-Head of Sustainability Investing research. He was responsible for the research methodology underpinning the S&P Dow Jones Sustainability Index. Previously he was responsible for water technologies business development in EMEA at the Danaher Corporation. Marc started his career at Trojan Technologies in London Canada, where he led a R&D team focusing on advanced water treatment technologies.
Marc holds a MSc in engineering from the ETH in Zurich, and a PhD from EAWAG in Environmental Chemistry and is the author of patents, scientific articles, technical and financial publications.
Share this article
This marketing material is issued by Pictet Asset Management (Europe) S.A.. It is neither directed to, nor intended for distribution or use by, any person or entity who is a citizen or resident of, or domiciled or located in, any locality, state, country or jurisdiction where such distribution, publication, availability or use would be contrary to law or regulation. The latest version of the fund‘s prospectus, Pre-Contractual Template (PCT) when applicable, Key Investor Information Document (KIID), annual and semi-annual reports must be read before investing. They are available free of charge in English on www.assetmanagement.pictet or in paper copy at Pictet Asset Management (Europe) S.A., 15 avenue J.F. Kennedy, L-1855 Luxembourg, or at the office of the fund local agent, distributor or centralizing agent if any. The KIID is also available in the local language of each country where the compartment is registered. The prospectus, the PCT when applicable, and the annual and semi-annual reports may also be available in other languages, please refer to the website for other available languages.Only the latest version of these documents may be relied upon as the basis for investment decisions.
The summary of investor rights (in English and in the different languages of our website) is available here and at www.assetmanagement.pictet under the heading "Resources", at the bottom of the page.
The list of countries where the fund is registered can be obtained at all times from Pictet Asset Management (Europe) S.A., which may decide to terminate the arrangements made for the marketing of the fund or compartments of the fund in any given country.
The information and data presented in this document are not to be considered as an offer or solicitation to buy, sell or subscribe to any securities or financial instruments or services.
Information, opinions and estimates contained in this document reflect a judgment at the original date of publication and are subject to change without notice. Pictet Asset Management (Europe) S.A. has not taken any steps to ensure that the securities referred to in this document are suitable for any particular investor and this document is not to be relied upon in substitution for the exercise of independent judgment. Tax treatment depends on the individual circumstances of each investor and may be subject to change in the future. Before making any investment decision, investors are recommended to ascertain if this investment is suitable for them in light of their financial knowledge and experience, investment goals and financial situation, or to obtain specific advice from an industry professional.
The value and income of any of the securities or financial instruments mentioned in this document may fall as well as rise and, as a consequence, investors may receive back less than originally invested.
The investment guidelines are internal guidelines which are subject to change at any time and without any notice within the limits of the fund's prospectus.
The mentioned financial instruments are provided for illustrative purposes only and shall not be considered as a direct offering, investment recommendation or investment advice. Reference to a specific security is not a recommendation to buy or sell that security. Effective allocations are subject to change and may have changed since the date of the marketing material.
Past performance is not a guarantee or a reliable indicator of future performance. Performance data does not include the commissions and fees charged at the time of subscribing for or redeeming shares.
Any index data referenced herein remains the property of the Data Vendor. Data Vendor Disclaimers are available on assetmanagement.pictet in the “Resources” section of the footer.
This document is a marketing communication issued by Pictet Asset Management and is not in scope for any MiFID II/MiFIR requirements specifically related to investment research. This material does not contain sufficient information to support an investment decision and it should not be relied upon by you in evaluating the merits of investing in any products or services offered or distributed by Pictet Asset Management.
Pictet AM has not acquired any rights or license to reproduce the trademarks, logos or images set out in this document except that it holds the rights to use any entity of the Pictet group trademarks. For illustrative purposes only.
Cookie Policy
This website uses cookies to enhance user navigation and to collect statistical data. To refuse the use of cookies, change your settings or for more information, please click on the following link: Cookies policy. By continuing to browse this website, you accept the use of cookies for the above purposes.