The incorporation of climate-related risks and considerations into investment portfolio decisions has grown as the availability and accuracy of corporate emissions data have improved.
A variety of greenhouse gas (GHG) indicators is now disclosed by companies and made available by specialist data providers. At the same time, there has also been a proliferation of equity benchmarks that aim to gauge companies' alignment with Paris Agreement targets.
Investors seeking to manage climate-related risks cannot limit themselves to scope 1 or even scope 2 emissions data.
Focusing on GHG emissions, this commentary seeks to shed light on the purpose and utility of these different metrics as well as their limitations. We argue that investors seeking to manage climate-related risks cannot limit themselves to scope 1 or even scope 2 emissions data; a scope 3 analysis is essential even if such data are not currently widely available. Investors who wish to both manage climate risks and make a positive contribution to the energy transition will need to deploy more complex carbon measurement techniques.
The Greenhouse Gas Protocol is the standard framework for the measurement and management of GHG emissions in the corporate world. It incorporates three different types of emissions.
Scope 1 emissions
These are a company's direct GHG emissions, those that stem from its operations and the resources it owns or controls. Examples of scope 1 emissions include the carbon dioxide produced by a coal-burning power plant.
Scope 2 emissions
These are a company’s indirect GHG emissions, or those that result from its purchased energy. Scope 2 emissions are essentially the scope 1 emissions of other companies. For example, when a car manufacturer purchases electricity from a power utility, its scope 2 emissions are effectively the utility’s scope 1 emissions.
Scope 3 emissions
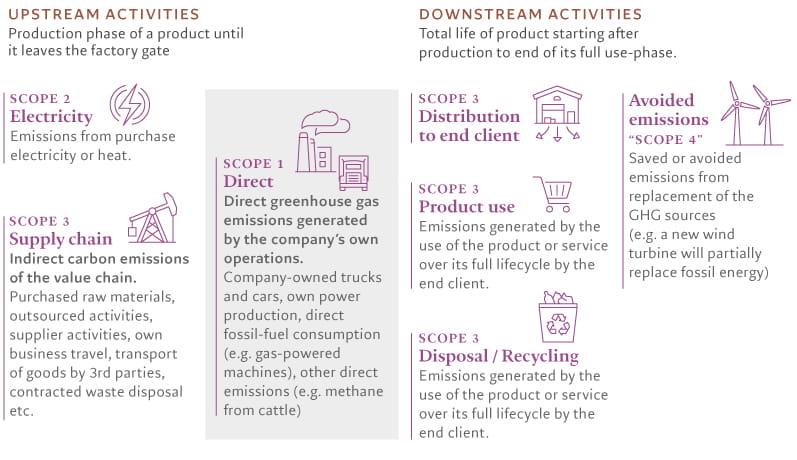
Scope 3 emissions are the indirect GHG emissions generated by every activity in a company’s value chain. Scope 3 emissions can be upstream, those generated by a firm’s suppliers, or downstream, those which arise during product useage and disposal (see Fig. 1). For a car manufacturer, for instance, the GHG emissions generated during the production of auto parts it receives from suppliers would be classified as upstream scope 3 emissions. The emissions released by car owners during the lifetime of the vehicle, meanwhile, represent the automaker’s downstream scope 3 emissions.
Fig.1 - Classification of greenhouse gas emissions
Source: Pictet Asset Management
Beyond the GHG carbon protocol - avoided emissions:
A relatively new concept that is not part of the official GHG protocol, avoided emissions aim to quantify the carbon-reducing effects of a company’s products or services.
These are sometimes referred to as scope 4 emissions, and typically apply to companies operating in the clean energy and environmental technology industries. A renewable energy company, for example, could be expected to have high avoided emissions because its products will generate far lower emissions relative to the fossil fuel-based power supplier it replaced.
03
Scopes: rationale and use cases
To use emission scopes in security selection and portfolio construction, it is important to understand what each category of data can offer investors and what its limitations are.
Scope 1: Responsibility to pay carbon price
Scope 1 emissions are best viewed as the first and essential building block in a hierarchy of emissions types, but one which, in isolation, provides a limited amount of practical information. Energy production (electricity, heating) and transportation companies are the main sources of scope 1 emissions. Not surprisingly, these are also the sectors most frequently covered by the emissions trading systems (ETS) being introduced by an increasing number of countries. As portfolio risk management tools, scope 1 emissions data have the advantage of being widely available; almost all companies provide such metrics on a regular basis, which means investors need perform only very basic calculations to determine the carbon footprint of their entire portfolio on this metric.
For investors expecting binding systems of carbon pricing to be introduced worldwide at some point, scope 1 emissions represent the equivalent of an emitter's legal obligation to pay a price for carbon (or carbon tax).
From this vantage point, scope 1 emissions appear to be a valid proxy for climate transition risk (or more specifically carbon risk). After all, industries that are at the heart of the climate debate such as power utilities and transportation are also high scope 1 emitters.
On closer inspection, however, scope 1 emissions data do not always provide an accurate assessment of a company's carbon risk. That's because carbon taxes often fail to penalise their intended target. Companies can pass on the cost of higher carbon prices to other businesses in their supply chain.
Firms that have monopolistic positions or strong pricing power, for instance, are able to transfer the cost of carbon taxes to their customers. In doing so, they also offload the risks associated with their scope 1 emissions. Under carbon pricing regimes, it is highly likely, for instance, that utilities pass on at least a portion of the carbon price to energy consumers, whether companies or households. This means that while scope 1 emissions are easy to calculate, relying on them exclusively to gauge investment risk can deliver misleading results. They provide only a partial view of a company’s carbon emission risk. This is why investors should not confine themselves to scope 1 emissions data.
Scope 2: direct carbon risk
Because scope 1 emissions can be transferred from emitters to their customers, scope 2 emissions are a major component of corporate carbon risk. Scope 2 emissions represent a company’s risk of having to pay the cost of an increasing carbon price out of its own profits. A prime example would be a capital goods manufacturer with high electricity consumption. Such a company may have very low scope 1 emissions but high scope 2 emissions. For this reason, combining scope 1 and 2 emissions provides a more comprehensive view of carbon risks to investors.
Scope 3: indirect carbon risk
Scope 3 captures emissions that occur across a company’s value chain. They are emissions that are linked to a company’s activities but that it does not directly control.
Having a clear sense of both upstream and downstream scope 3 emissions is useful as they represent the upper bound of a firm's carbon-related risk. In other words, they indicate the carbon risk of a company that possesses no pricing power and is forced to bear the entire cost of rising carbon prices across its value chain. In reality, however, the picture is more complex. A company’s exposure to carbon price increases is invariably linked to the bargaining power it has relative to its suppliers and customers.1
Firms that enjoy dominant positions across their value chain – those large enough to set their terms of business – are generally less exposed to carbon risk for a given level of scope 3 emission as they’re able to pass these risks on. Firms that are price takers, by contrast, will typically be more fully exposed to the carbon risk indicated by their scope 3 emissions. As companies may have a different level of pricing power in their upstream and downstream markets, distinguishing between the two types of scope 3 emissions is often crucial to investment decisions.
Fig. 2 - Volkswagen greenhouse gas emissions, by scope*
Source: Volkswagen Sustainability Report 2021, annual data; *figures given are CO2 equivalent, a metric used to compare different greenhouse gas emissions based on the global warming potential in a common unit
Consider the environmental credentials of the auto manufacturer Volkswagen (VW). Clearly, the dominant source of the company’s GHG emissions is car useage. This is defined as downstream scope 3 emissions. For investors considering an investment in VW, this is the relevant dimension when assessing any potential risk to the firm’s profitability. This would help quantify the threat of an unexpected increase in carbon prices resulting, for example, from a hike in gasoline taxes.
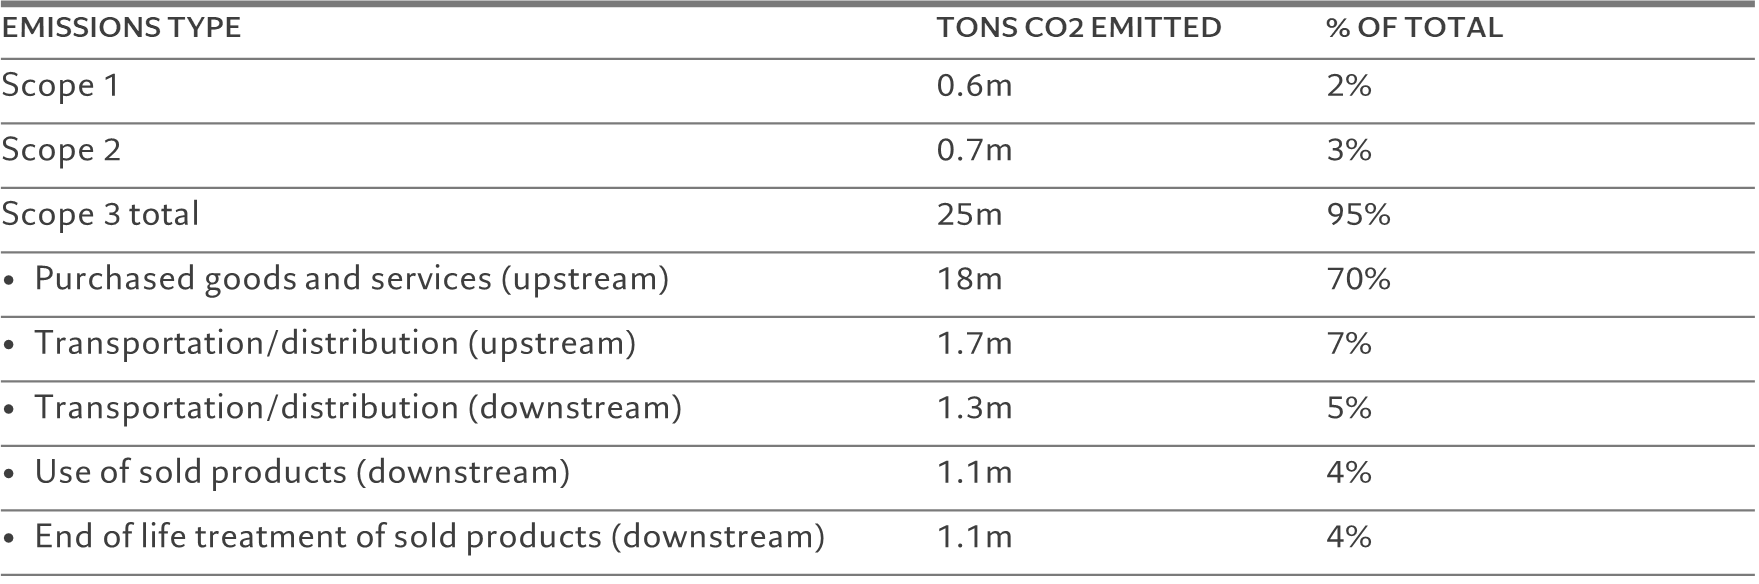
Another sector for which scope 3 emissions are an essential part of climate risk analysis is food manufacturing. Yet here it is the up-stream component that matters most. Take Kraft Heinz, the global food producer. For this company, purchased goods and services – all upstream scope 3 emissions – account for the bulk of the company’s total emissions. This is likely a result of its reliance on carbon-intensive ingredients such as red meat and indicates that any spike in carbon prices could very easily feed through to its input costs.
Fig. 3 - Kraft Heinz greenhouse gas emissions, by scope
Source: Kraft Heinz ESG Report, 2021, annual data; figures given are CO2 equivalent
In addition to upstream and downstream components, scope 3 emissions also incorporate embodied carbon, a phenomenon that is generally confined to the real estate industry.
Embodied emissions essentially capture all the carbon emitted during the construction phase of a building, including those associated with raw material extraction and processing.
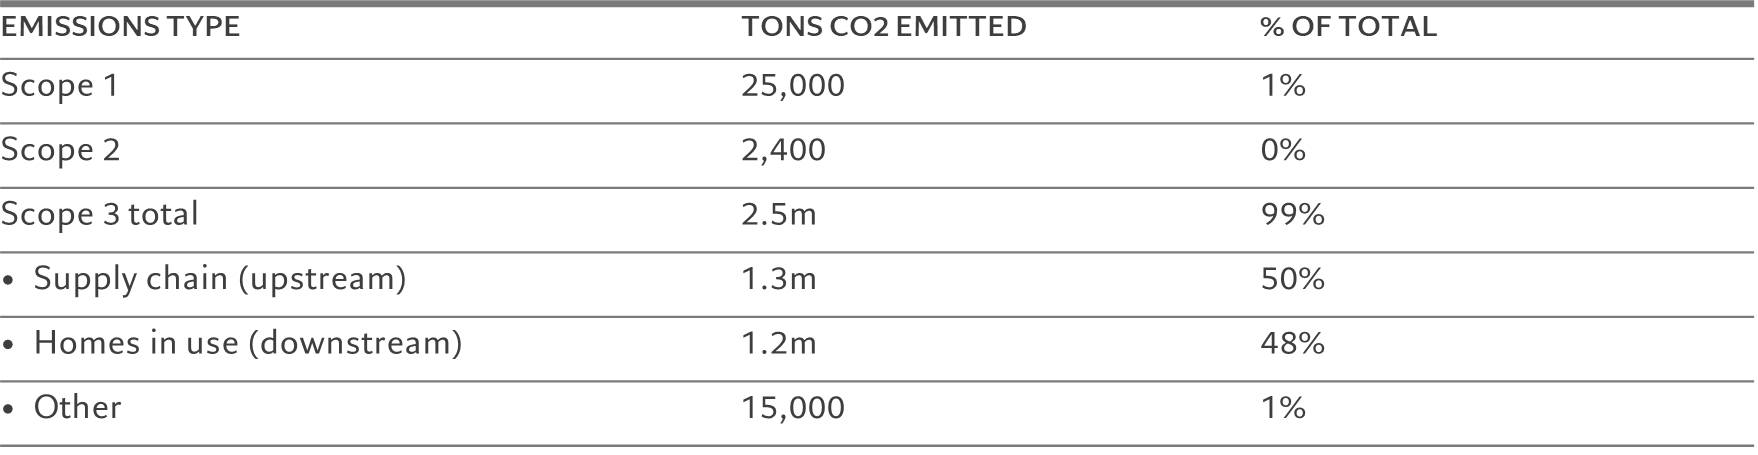
For the UK home builder, Persimmon, for example, scope 3 emission account for 99 per cent of its total carbon footprint, with upstream scope 3 emissions representing over half of that.
While environmentally conscious real estate investors gravitate towards energy efficient buildings that are built to be run with a low carbon footprint (downstream scope 3), Persimmon’s figures illustrate that upstream emissions can account for at least as large a fraction of the total.
Fig. 4 - Persimmon greenhouse gas emissions, by scope
Source: Persimmon Sustainability Report, 2021, annual data; figures given are CO2 equivalent
04
Additional considerations
For investors seeking to manage their exposure to climate-related risks, then, a scoring method that combines scope 1, 2 and 3 measures is the most effective way of measuring and comparing companies’ carbon footprints. One potential drawback in using this approach to assess a portfolio’s total climate risk is the risk of double counting.
This occurs when the companies included in a portfolio form part of the same value chain.2 Double counting could be troublesome, for instance, for international policy makers seeking to compare the actual GHG emissions arising from specific geographic areas, such as those represented by regional stock indexes. For such an application, where the climate risk of the underlying companies is not the main focus, avoiding multiple counting of the same emissions might be relevant.
Even so, it’s important to note that there aren’t many cases in which double counting creates significant problems for investors.
Indeed, if the purpose of GHG footprinting is to assess the climate transition risk in a portfolio, double counting can be desirable as a rise in the price of carbon is likely to reverberate through multiple supply chains.
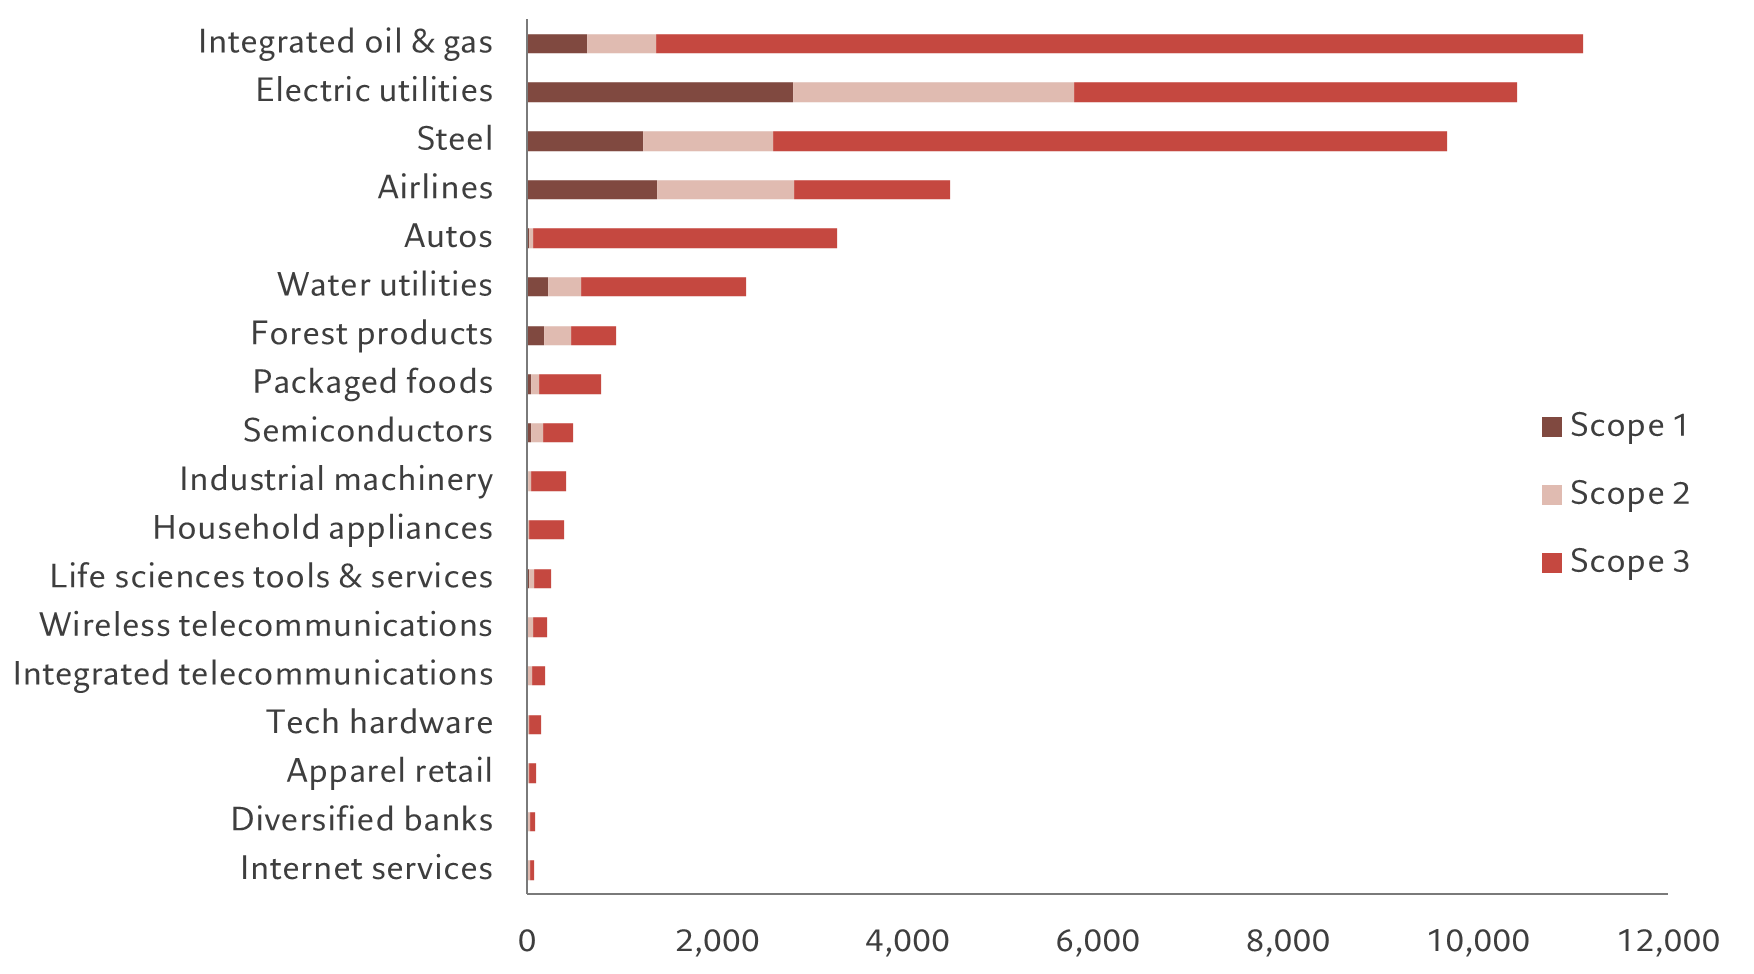
Fig. 5 - Carbon intensity by industry
Tons of CO2 equivalent, by scope, per million EUR of revenue
Source: Sustainalytics, Pictet Asset Management, data as of 31.12.2021
For all the benefits of using scopes 1, 2 and 3, it is worth bearing in mind that there are trade-offs involved in using scope 3 in particular.
An obvious one is data quality. Scope 3 emissions are not routinely reported by companies and when they are, they often capture only a portion of the value chain (e.g. only upstream). When data is missing, ESG data providers turn to estimation methods that have a margin of error.
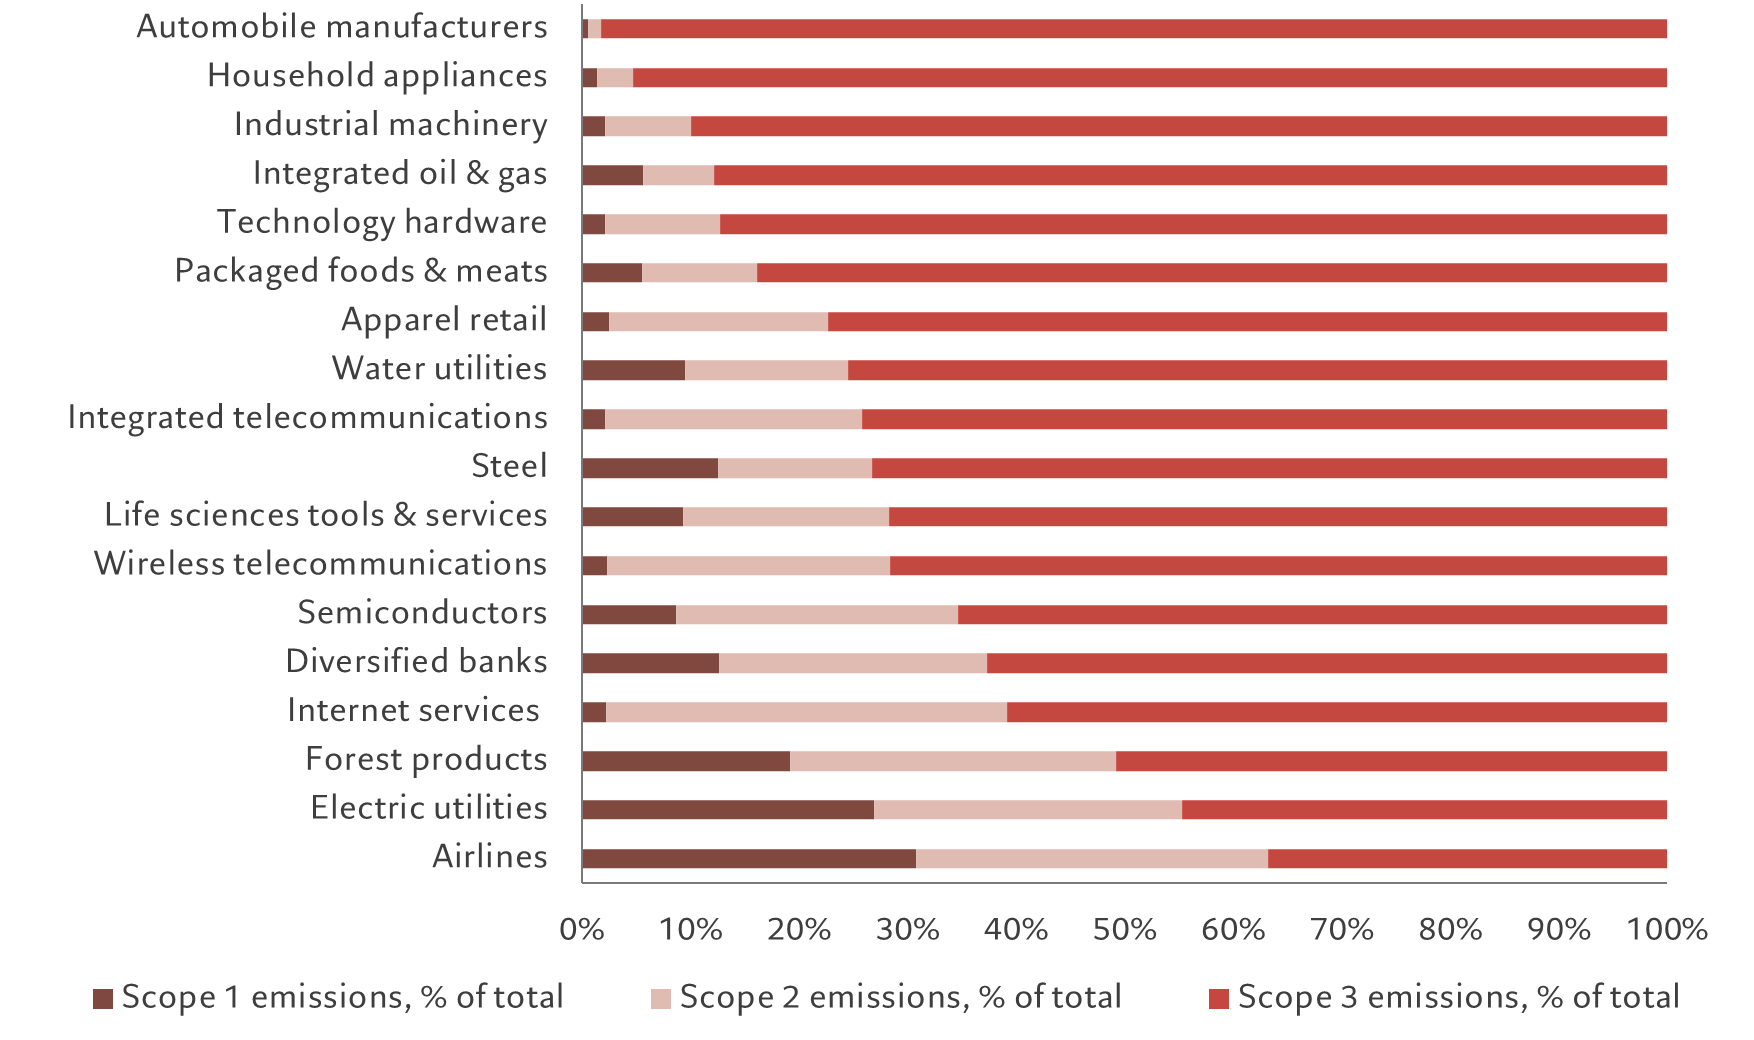
Fig. 6 - Composition of carbon emissions by scope, selected industries, %
Source: Sustainalytics, Pictet Asset Management, data as of 31.12.2021
More than risk management
While using scopes 1, 2 and 3 emissions as analytical tools can help investors better manage carbon risk, the approach can also open up investment opportunities.
Having a comprehensive understanding of a company’s GHG emissions and how they might evolve over time can help investors:
- Identify which issuers are leaders and laggards on the path toward decarbonisation
- Assess whether their valuations reflect this appropriately
- Identify alpha-generating opportunities
05
Avoided emissions
For those who wish to pursue impact investing (seeking to make a positive contribution in addition to securing a financial return) scope 1, 2 and 3 emissions are insufficient metrics because they do not capture the positive contribution a company’s products and services may have in facilitating the climate transition. For example, a wind turbine manufacturer would have a sizeable scope 2 and 3 emission footprint, reflecting the emissions from the extraction and processing of raw materials as well as those from manufacturing processes. Yet its positive contribution - the role it plays in the substitution away from fossil fuel-powered electricity generation (i.e. the avoided emissions) is not captured. Yet, that is exactly the dimension that impact investors would consider crucial.
Fig. 7 - Vestas carbon footprint, by scope
Source: Vestas Sustainability Report 2021, annual data; figures given are CO2 equivalent
While the relevance of avoided emissions is clear, estimating them is complex and inevitably relies on a number of assumptions. As a concept, the substitution effect represents a departure from a counterfactual baseline scenario. In other words, it is difficult for investors to ascertain what the climate outcome would have been in the absence of the product or service in question.
That would correspond to the ideal of additionality as advocated by many impact investors.3 Yet because it not possible to accurately calculate the net emissions avoided due to the adoption of a product or service, it is necessary to use proxies. One way of doing so involves comparing a new product’s full life-cycle emissions to that of the product it is looking to replace. While methodologies are still evolving, the technical problems are not insurmountable.
06
Driving climate change mitigation
But having accurate emission readings won't in and of itself ensure investors achieve their climate goals. To do that, such data needs to be used as part of a broader engagement and capital re-allocation programme.
As we have argued elsewhere, investors’ key contribution to halting climate change comes via two channels: 1) through actively engaging with companies to encourage them to transition and 2) through financing climate solutions, which require a concept such as avoided emissions to assess.
Within listed equities markets, improvements in the measurement of corporate carbon footprints have given rise to a growing number of environmentally-themed investment strategies, many of which aim to invest in businesses that provide solutions to environmental challenges through the products and services that companies offer.
Calls for climate investment solutions, in particular by impact investors, are likely to only grow louder, as will demands for standardisation and the adoption of avoided emissions measurement approaches.
Calls for climate investment solutions, in particular by impact investors, are likely to only grow louder, as will demands for standardisation and the adoption of avoided emissions approaches.
07
Reported and estimated data
For investors who wish to use scope 3 or avoided emissions in portfolio construction, data quality is an important consideration. Disclosure of scope 3 emissions is still incomplete for many companies. As a result, ESG data providers have in a number of instances developed methods to estimate scope 3 figures in order to fill gaps in their databases. Such model-based approaches typically rely on statistical methods to infer scope 3 emissions based on company characteristics and available data for peers.
While estimates and proxies should always be treated with caution, they play an important role, giving investors a basis upon which to engage with the companies they invest in. Third party data can be used as means to agitate for an improvement in corporate disclosure and auditing. Ultimately, with emissions data quantity and quality improving, investors can expect scope 3 data to be increasingly reported and available in ESG databases.4
For investors who wish to use scope 3 or avoided emissions in portfolio, data quality is an important consideration.
08
Concluding remarks
Understanding the use and limitations of the different GHG emissions scopes is critical for climate-aware investors. For risk-focused investors, considering scopes 2 and 3 is relevant to gain a comprehensive understanding of a company’s carbon risk. For impact-oriented investors, the measurement of avoided emissions, while a less established approach, will soon become vital.
[1] In precise economic terms, this reflects the relative elasticities of supply and demand in all relevant intermediate markets.
[2] For example, consider the case where a utility provides electricity to a nearby manufacturing firm. If both companies are held in a portfolio for which GHG emissions are measured on a combined scope 1 and 2 basis, the electricity sold by the utility to the manufacturing company would be counted twice.
[3] For a more detailed discussion of this topic, see Thematic equities as impact investments, Pictet Asset Management, 2021
[4] The EU’s Corporate Sustainability Reporting Directive, expected to take effect between 2024 and 2028 will likely help standardise this type of disclosure.
09
Appendix - Case study: beyond carbon emissions
While climate change is the primary focus for environment-oriented investors, GHG emissions are only one aspect of humanity's environmental footprint. Environmental degradation comes in many forms and each must be addressed to build a more sustainable economy.
The planetary boundaries framework, a model developed in 2009 by a group of scientists coordinated out of the Stockholm Resilience Centre, provides a more holistic view, identifying eight other dimensions crucial to the wellbeing of the planet. The framework can be used to screen investments and to measure the environmental footprint of portfolios.
Fig. 8 - Planetary Boundaries and Life Cycle Assessment: an example
Source: Pictet Asset Management
Each of PictetAM's thematic investment portfolios has embraced this framework and uses it to estimate companies’ ecological footprint along all nine planetary boundary dimensions. This is achieved by using an auditing tool known as Life Cycle Assessment (LCA), which measures a company's environmental impact across its entire value chain. This tool incorporates scope 1, 2 and 3 emissions as well as avoided emissions, wherever they are relevant. Although such in-depth analysis isn't suitable for every investor, we believe it should form part of an impact investment approach; it is also being deployed by investors that wish to pursue social objectives.
Stephen Freedman joined Pictet Asset Management in 2019 and is Head of research and sustainability, Thematic Equities. He also chairs the Thematic Advisory Boards.
Before joining Pictet, Stephen was at UBS Wealth Management, where he most recently served as head of Sustainable Investing Solutions for the Americas, based in New York. Prior to that he served in various Investment Strategy roles, including head of Thematic Investing Strategy and head of Tactical Asset Allocation. He started his career with UBS in Zurich in 1998 as an economist and public policy analyst. Since 2018, he has been teaching environmental finance at New York University.
He was also the founding co-chair of the Columbia University Seminar on Sustainable Finance from 2016 to 2019.
Stephen holds a Doctorate (PhD) and a Masters in economics from the University of St. Gallen. He is a CFA charterholder and earned the FRM designation from the Global Association of Risk Professionals.
About
Xavier Chollet
Xavier Chollet joined Pictet Asset Management in 2011 as a Senior Investment Manager in the Thematic Equities Team.
Previously, he was with Pictet’s Wealth Management division since 1998 as an analyst covering technology as well as clean energy starting in 2007. He also managed two internal portfolios on solar energy and energy efficiency.
Xavier holds a Master’s degree in Finance from HEC Lausanne.
Share this article
Important legal information
This marketing material is issued by Pictet Asset Management (Europe) S.A.. It is neither directed to, nor intended for distribution or use by, any person or entity who is a citizen or resident of, or domiciled or located in, any locality, state, country or jurisdiction where such distribution, publication, availability or use would be contrary to law or regulation. The latest version of the fund‘s prospectus, Pre-Contractual Template (PCT) when applicable, Key Information Document (KID), annual and semi-annual reports must be read before investing. They are available free of charge in English on www.assetmanagement.pictet or in paper copy at Pictet Asset Management (Europe) S.A., 6B, rue du Fort Niedergruenewald, L-2226 Luxembourg, or at the office of the fund local agent, distributor or centralizing agent if any.
The KID is also available in the local language of each country where the compartment is registered. The prospectus, the PCT when applicable, and the annual and semi-annual reports may also be available in other languages, please refer to the website for other available languages. Only the latest version of these documents may be relied upon as the basis for investment decisions.
The summary of investor rights (in English and in the different languages of our website) is available here and at www.assetmanagement.pictet under the heading "Resources", at the bottom of the page.
The list of countries where the fund is registered can be obtained at all times from Pictet Asset Management (Europe) S.A., which may decide to terminate the arrangements made for the marketing of the fund or compartments of the fund in any given country.
The information and data presented in this document are not to be considered as an offer or solicitation to buy, sell or subscribe to any securities or financial instruments or services.
Information, opinions and estimates contained in this document reflect a judgment at the original date of publication and are subject to change without notice. The management company has not taken any steps to ensure that the securities referred to in this document are suitable for any particular investor and this document is not to be relied upon in substitution for the exercise of independent judgment. Tax treatment depends on the individual circumstances of each investor and may be subject to change in the future. Before making any investment decision, investors are recommended to ascertain if this investment is suitable for them in light of their financial knowledge and experience, investment goals and financial situation, or to obtain specific advice from an industry professional.
The value and income of any of the securities or financial instruments mentioned in this document may fall as well as rise and, as a consequence, investors may receive back less than originally invested.
The investment guidelines are internal guidelines which are subject to change at any time and without any notice within the limits of the fund's prospectus.
The mentioned financial instruments are provided for illustrative purposes only and shall not be considered as a direct offering, investment recommendation or investment advice. Reference to a specific security is not a recommendation to buy or sell that security. Effective allocations are subject to change and may have changed since the date of the marketing material.
Past performance is not a guarantee or a reliable indicator of future performance. Performance data does not include the commissions and fees charged at the time of subscribing for or redeeming shares.
Any index data referenced herein remains the property of the Data Vendor. Data Vendor Disclaimers are available on assetmanagement.pictet in the “Resources” section of the footer.
This document is a marketing communication issued by Pictet Asset Management and is not in scope for any MiFID II/MiFIR requirements specifically related to investment research. This material does not contain sufficient information to support an investment decision and it should not be relied upon by you in evaluating the merits of investing in any products or services offered or distributed by Pictet Asset Management.
Pictet AM has not acquired any rights or license to reproduce the trademarks, logos or images set out in this document except that it holds the rights to use any entity of the Pictet group trademarks. For illustrative purposes only.
Cookie Policy
This website uses cookies to enhance user navigation and to collect statistical data. To refuse the use of cookies, change your settings or for more information, please click on the following link: Cookies policy. By continuing to browse this website, you accept the use of cookies for the above purposes.