I am Article Layout

Now Reading: Barometer: Waiting for stimulus to kick in

Select your investor profile:

This content is only for the selected type of investor.

Monthly Asset Allocations Views

April 2020
Marketing Material

Barometer: Waiting for stimulus to kick in

Governments and central banks are battling hard to contain the economic effects of a global pandemic. While the stimulus should benefit riskier assets, we continue to tread carefully.

01

Asset allocation: policy bazooka

The global economy is grinding to a halt.

Nearly one in three people in the world is under lockdown to stop the coronavirus outbreak, leading to widespread factory and shop closures.

Testifying to the gravity of the problem policymakers face, the most recent jobless data showed the number of Americans filing claims for unemployment benefits hit a record
3.28 million in the week to March 21. That’s a surge of more than 3 million from the previous week.

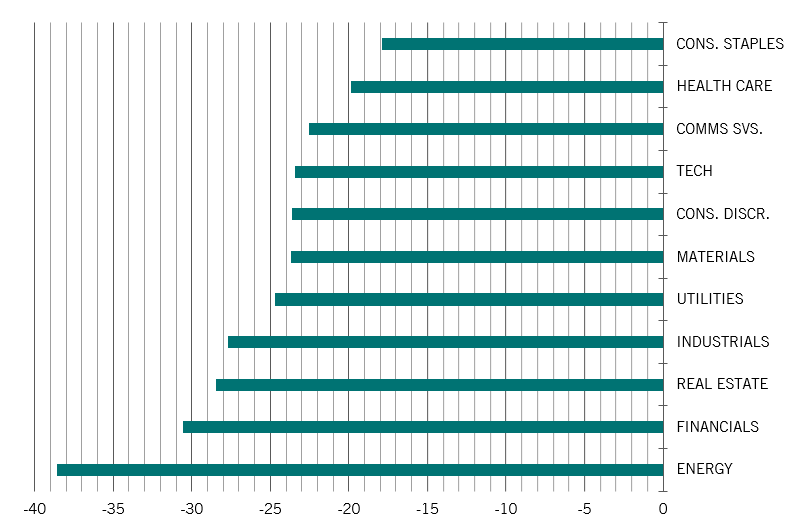
In such an environment, corporate profits are sure to decline sharply, as will dividends. Financial markets have consequently experienced dizzying levels of volatility.

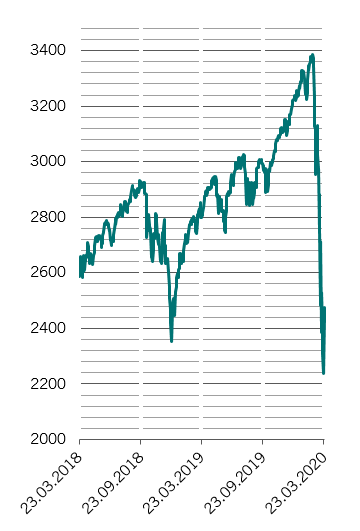
The S&P 500 index, for example, fell 35 per cent in the space of a few weeks – a decline that is comparable to that of Black Monday in 1987 and the 1929 crash.

Drastic times call for drastic measures, and that’s precisely what central banks and governments worldwide are putting in place.

We expect central banks to provide monetary stimulus that is equivalent to as much as a tenth of global GDP this year, while fiscal easing will equate to around 4 per cent of economic output.

It is thanks to these truly bold, coordinated measures that we believe the global economy will avoid a prolonged downturn.

However, investors should not let their guard down. Financial markets will experience renewed bouts of volatility in the coming weeks as the extent of economic damage from the pandemic becomes clear. For these reasons, we keep our neutral stance on equities and bonds.

Fig. 1 Monthly asset allocation grid
April 2020
April 2020 Barometer grid
Source: Pictet Asset Management

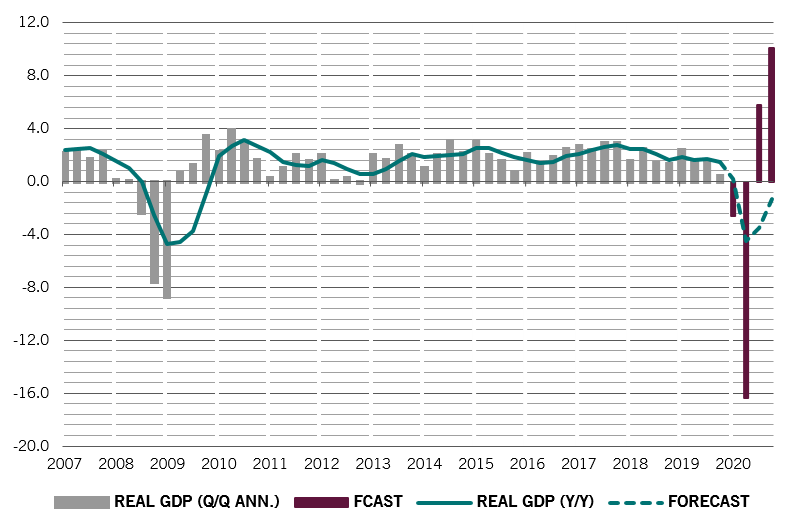
Our business cycle analysis shows the global economy will contract by 0.4 per cent this year.

Developed economies – especially the euro zone – will be in the firing line, while emerging counterparts, led by a recovering China, should fare better.

Not long ago the epicentre of the outbreak, China is gradually getting back to work. Judging from the country’s coal consumption and traffic congestion data, we estimate that China’s economic activity has returned to more than 80 per cent of normal levels.

Its economic recovery, therefore, could prove as sharp as its earlier slowdown.

The world’s second largest economy will grow 2 per cent this year – still short of what was needed to achieve Beijing’s objective of doubling its GDP and income in the decade to 2020.

Fig. 2 - A V-shaped recovery?
Real GDP growth in developed markets, actual and forecast, %
Real GDP growth in developed markets, actual and forecast
Source: Pictet Asset Management, Refinitiv. Data covering period 01.01.2007-01.10.2020

Our liquidity models estimate that the world’s central banks will provide monetary stimulus of USD5.7 trillion, or 10 per cent of GDP – a third more than what they did in 2008-2009.

Some USD3.4 trillion will likely come from the US, where the US Federal Reserve is buying USD600 billion of bonds in a single week – six times the total amount it purchased in the last round of quantitative easing.

We think the Fed has plenty more ammunition at its disposal – the scale of bond purchases, in our view, could easily double from current levels.

The Fed’s corporate bond purchase programme, conducted via the Exchange Stabilisation Fund (ESF) – a Treasury-funded special leveraged vehicle, could buy as much as USD4 trillion of credit.

The European Central Bank, for its part, will inject EUR1 trillion of liquidity into the financial system.

We think the region’s policymakers stand ready to do more – likely to abandon the self-imposed limits on bond purchases and deploy Outright Monetary Transactions (OMT), an emergency scheme which allows the ECB to make unlimited purchases of a particular country’s debt.

At a global level, central bank money printing will effectively underwrite this year’s government spending, which so far amounts to some USD2.2 trillion.

Following stocks’ sharp fall in just five weeks, our valuation readings show global equities have priced in a lot of bad news.

Equity markets indicate investors expect a double-digit cut in dividends in the US, euro zone and Japan this year while our own analysis shows that profits generated by S&P 500 companies will decline by more than 10 per cent this year.1

But our long-term model suggests global equities will outperform bonds by more than 10 per cent every year in real terms in the next five years.2

Current equity valuations should, therefore, prove attractive for long-term investors.

Our technical readings show equity markets are “oversold”. Sentiment and investment flow gauges indicate an extreme level of pessimism.

That said, there remains the possibility for more market swings, due in large part to the unwinding of instruments linked to volatility indices.

02

Equities regions and sectors: staying defensive

Global equities are cheap – in some cases, the cheapest they have been in two decades or more. The price-to-earnings ratio for stocks in the MSCI World Index dropped to 15 times on March 25 from a peak of 21 on February 19.

How attractive this is depends on investors' time horizons. Equity risk premia (ERP) – the excess returns stock markets are estimated to provide over the risk free rate – are flirting with all-time highs across the board. Which suggests that relative to bonds, equities have never been more attractive for long-term investors. Over the next five years, our models suggest that real returns on US equities will average 7.5 per cent per annum, while US bonds should deliver -3.5 per cent.

In the short term, however, we believe the situation warrants a more nuanced approach. It is unclear when the battle against the pandemic will be won. Nor can policymakers be sure how much economic damage they will need to repair.

Globally, company earnings will take a major hit from the upcoming recession. Using our GDP forecasts, we estimate US earnings could fall by at least 10 per cent this year.

Regionally, we continue to like emerging markets, where we expect the economic fallout from the coronavirus to be less pronounced than in the developed world, with growth returning already in the second quarter. China is already starting to re-open.

We are neutral on both European and US equity markets, where we believe valuations broadly already reflect the most likely economic scenarios. (Historically, our analysis shows, the peak to trough decline in GDP in percentage terms has been accompanied by an equity market drop that is 10 times greater. This suggests stock valuations are consistent with a 3-4 per cent reduction in world GDP.)

Fig. 3 - Defensives outperform
MSCI ACWI sectors, total return in local currency since market peak, %
MSCI ACWI sectors, total return in local currency since market peak
Source: Refinitiv. Data covering period 19.02.2020-26.03.2020

Among sectors, we retain our overweight in healthcare, which has understandably held up better than the broader market. Losses from technology stocks  have also been relatively modest (see Fig. 3 ). We believe this is not just because employees and consumers are now using more technology – to work from home, socialise and shop and online, to 3D-print equipment, and so on – but also because the technology sector is net cash positive and will likely sustain its high profit margins as the industry further consolidates. That puts it in a very strong position as the global economy slows and banks become more reluctant to lend.

However, as technology is by far the most expensive sector in our grid, we prefer to raise exposure communication services – where we see many similar characteristics and opportunities but which investors can access at a cheaper price. We upgrade communication services to overweight.

Higher up the risk spectrum, we also see some potential in financials. Arguably, these stocks offer a cheap hedge against the possibility of a near term market rebound – financials are currently the cheapest they’ve been over the past 20 years. Crucially, the banking sector is now in a very different fundamental position than during the global financial crisis of 2008-2009 and it appears most major banks will be able to absorb any losses with their existing excess capital.

At the other end of the scale, we remain underweight consumer discretionary. In the short term, the consumer sector, especially consumer discretionary is probably going to be the most negatively affected by the coronavirus fallout, especially once the impact on the labour market is more clearly visible. It is also still relatively expensive – in second place after tech in our model.

03

Fixed income and currencies: high grade looking better

Risks are multiplying at a rapid clip. But so too are opportunities. That is the picture confronting investors surveying the corporate bond market. In the US, prospects for investment-grade fixed income are brightening somewhat as the Fed’s move to extend its stimulus measures to corporate debt will, we believe, provide support to the market.

Yield spreads on investment grade US company debt have widened some 100 basis points to 350 basis points since the end of January as doubts have grown over corporate America's ability to service its debts. But with the Fed having set up two programmes to help higher rated companies – one an emergency credit facility, the other a corporate bond purchasing vehicle – spreads on such securities should narrow in months ahead.

The picture is similar in Europe, where the ECB is also extending quantitative easing to include corporate bonds. We have upgraded both European and US corporate debt to neutral from underweight.

QE help
US investment grade and high yield debt, option adjusted spreads (OAS), bps
US investment grade and high yield debt, option adjusted spreads (OAS)
Source: Refinitiv. Data covering period 22.03.2000-25.03.2020

Investment grade debt, however, is the only area of the corporate bond market with improving fundamentals. 

High yield bonds, by contrast, look susceptible to a further sell off in the near term. In aggregate, they do not yet offer a sufficiently large yield premium as insurance against an economic slowdown that threatens to weaken company balance sheets. Lacking the central bank support their higher-grade counterparts have received, US and European high yield bonds remain vulnerable. Both markets are home to an ever-growing number of zombie companies, firms whose current profits don’t cover annual debt servicing costs. According to the Bank for International Settlements, zombies account for some 5 to 10 per cent of all businesses worldwide. US speculative-grade bonds are in a particularly precarious position given that energy companies – whose earnings prospects are under pressure thank to the oil price plunge – make up some 15 per cent of the high yield bond benchmark. We therefore remain underweight both European and US high yield.

We remain overweight emerging market local currency debt: yields on shorter-dated bonds are likely to fall sharply as central banks across the emerging world unleash additional stimulus measures. Indeed, a distinguishing feature of this global crisis is that policymakers in emerging markets are using the same unconventional tools as their counterparts in advanced economies.

04

Global markets overview: off the scale

Global equity markets were on course for the biggest monthly decline since 2008 of nearly 15 per cent, in US dollar terms, as deepening panic over the economic fallout of the coronavirus outbreak encouraged investors to dump risky assets and seek safety in gold and sovereign bonds.

Energy was the worst performing sector as it moved more or less in lockstep with a 45-percent plunge in oil prices. Almost all equity sectors registered a double-digit declines, with financials falling more than 20 per cent. Staples and health care companies fared better with a loss of 7 per cent, while other defensive sectors such as utilities also avoided the worst effect of the sell-off.

Fig. 5- Worst since the financial crisis
S&P 500 composite price index
Source: Refinitiv. Data covering period 23.03.2018-25.03.20

Equities in Latin America fell more than 30 per cent.

Stocks in emerging Asia, where life is gradually returning to normal in some countries, outperformed those in Europe and the US.

Global bonds edged higher in March, thanks mainly to safe-haven Treasuries which rose by more than 3 per cent.

The benchmark 10-year Treasury yield hit a record low of 0.9 per cent. US 10-year T-bonds have outperformed US equities by as much as 30 per cent in the past three months.

In contrast, emerging bonds – local and hard currency as well as corporate – all fell more than 10 per cent.

In the credit market, US high-yield bonds fell 13 per cent as bankruptcy fears hit energy issuers. European investment grade bonds, and their US counterparts to some extent, managed to limit their losses thanks to monetary stimulus.

The dollar was on course to end the month broadly flat, while the safe-haven Swiss Franc was the biggest gainer as it rose more than 1 per cent. Currencies of commodity-producing countries such as Mexico, Brazil, Russia and South Africa fell more than 10 per cent each versus the dollar.

05

In brief

barometer april 2020

Asset allocation

Coordinated monetary and fiscal stimulus help cushion the economic blow from the virus outbreak. We remain neutral in equities and bonds.

Equities regions and sectors

We upgrade communication services as the sector experiences renewed demand. We continue to prefer defensive sectors, such as pharmaceuticals; we also see value in financials.

Fixed income and currencies

We upgrade European and US corporate debt to neutral from underweight; we continue to prefer EM local currency bonds.