I am Article Layout

Now Reading: Barometer: A little less growth, a little more inflation

Select your investor profile:

This content is only for the selected type of investor.

BAROMETER OF FINANCIAL MARKETS JUNE INVESTMENT OUTLOOK

June 2021
Marketing Material

Barometer: A little less growth, a little more inflation

Economic growth will soon slow but inflationary pressures could linger for some time. Which means investors should consider a more defensive stance.

01

Asset allocation: equities head into tougher terrain

Inflation has become investors’ chief concern. Price pressures are clearly building – US core CPI in April hit 3.0 per cent year-on-year, its highest level since 1995. But what is less clear is whether the rise is transitory or points to a more fundamental change in economic conditions as the world recovers from the pandemic.

Our analysis paints a positive picture over the short term. Strip out Covid-sensitive items from price gauges and inflation looks modest, having barely picked up at all in April. (We remove prices for air fares, lodging, used cars, car rentals, tvs, toys and personal computers). Look ahead, however, and the potential for a build-up in price pressures is considerable. Even if there is little evidence of a rise in wages, US consumers have plenty of disposable income, having accumulated some USD2 trillion in savings. Should as little as a third of that be spent on services – a bigger component of CPI than goods - it is possible to see core inflation hovering between 3.5 and 4 per cent in a years’ time.


Fig. 1 - Monthly asset allocation grid

June 2021

Asset allocation grid
Source: Pictet Asset Management

While such a prospect is, in itself, a cause for some concern, what worries us more is the possibility of high inflation coinciding with a slowdown in economic and corporate profit growth. Our leading indicators point in that direction. Growth is already moderating appreciably in China and also easing a little in the US; the global three-month rate of expansion has recently halved to 7 per cent.

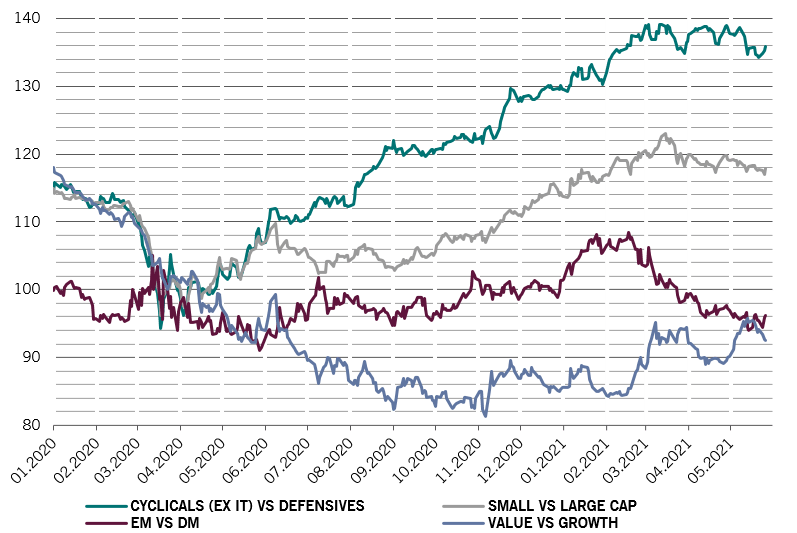
So with financial markets facing the possibility of persistent price pressures and weaker growth (see Fig. 2), we retain our neutral stance on stocks and shift to more defensive areas of the equity market.

Although economic conditions remain buoyant, our business cycle gauges suggest GDP growth will slow over the second half of the year; inflationary pressures, meanwhile, will linger. Signs of deceleration have multiplied in China, where recent data show that both industrial production and construction activity were below their normal levels for the month of April. Industrial profits for the month grew at a year-on-year rate of 57 per cent, down from 92 per cent the previous month. Elsewhere in emerging markets, price pressures have been building, with CPI having risen from below 2 per cent at the end of last year to above 3 per cent on average.

Japan is another weak spot. Our leading indicators point to a sharp decline in economic activity as Japanese authorities struggle to speed up vaccinations while trying to contain a fourth wave of the virus outbreak. Economic conditions in the US, meanwhile, are strong yet prospects remain hostage to potentially inflationary imbalances in demand and supply. While retail sales are booming – currently 18 per cent above pre-pandemic levels – industrial production is a lacklustre 3 per cent below normal.

Compared to the US, Europe is at the very early stages of a post-pandemic recovery. But with around 30 per cent of the population having received a first Covid vaccination and 10 per cent fully vaccinated, economic growth should begin to pick up rapidly over the summer.


Fig. 2 - Inflation overshoot, growth undershoot?

Economic growth surprise index vs inflation surprise index

AA - econ inflation.png

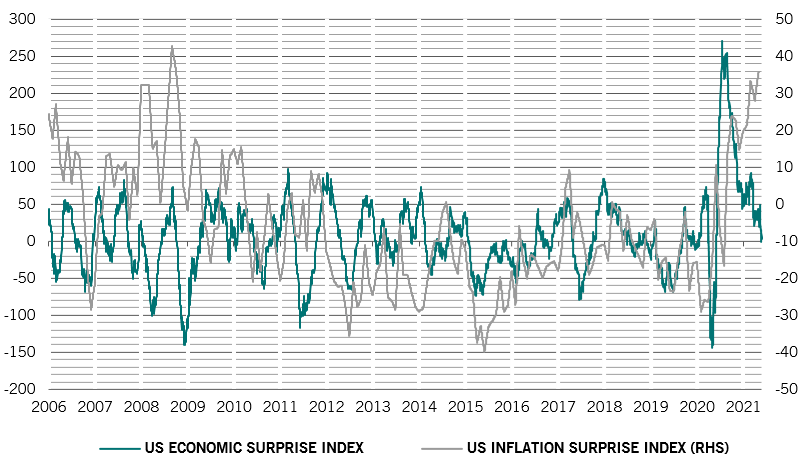
Source: Refinitiv, Pictet Asset Management; data covering period 31.12.2005-25.05.2021

The provision of monetary stimulus from central banks remains just about sufficient to underpin riskier asset classes, our liquidity indicators show. The volume of liquidity flowing into the financial system is growing at a much slower pace, currently only one standard deviation above the long-term trend rate, down from four standard deviations a few months ago. Nevertheless, that aggregate reading masks the growing prospect of a sharp drop in short term US interest rates, the possible result of commercial banks parking ever increasing amounts of surplus cash at the US Federal Reserve’s reverse repurchase facility.

Looking ahead, it is unclear how long markets will be able count on support from central banks. The Peoples Bank of China has already tightened the monetary reins while the Fed, contending with a flood of fiscal stimulus, excess cash in the financial system and pent up consumer demand, will soon face a choice between withdrawing support early but modestly, or later this year/early 2022 but more aggressively. As things stand, it would seem policymakers prefer the latter.

Valuations indicate equities are expensive relative to bonds. The gap between equities’ earnings yield and bond yields is at its lowest level since 2008 while our ‘equity bubble’ index has now reached levels last seen in 1999 and 2007.

Our technical indicators paint a mixed picture. Seasonal trends favour bonds over equities. Nevertheless the scope for a decline in stock markets remains limited as investor surveys show investors scaled back on their holdings of stocks.


02

Equities regions and sectors: the case for the defence

Even on a seemingly bright day, it can be prudent to take an umbrella (as anyone living in the UK, at least, will testify). The same principle increasingly applies to equity investing. In the wake of the stock market's strong gains year to date, it's an opportune time to take some precautions. And for a number of reasons.

To begin with, there are tentative signs that economic growth has peaked, especially in China and more recently in the US. At the same time, inflation risks are building – a combination that, historically, has been unfavourable for risky assets, such as equities. 

True, corporate profits have been extremely robust, with stellar first quarter results – profits among S&P 500 companies jumped some 50 per cent, roughly double the expected rate. But now the consensus for the full year has broadly caught up with our own forecasts (37 per cent in US), limiting the scope for future positive surprises. Indeed, we believe that consensus forecasts for corporate earnings per share and profit margins are too optimistic for 2022/25. 

That’s not to say we expect an imminent sell-off. But we do think some caution is warranted. Therefore we are reducing our allocation to some of the more vulnerable and expensive-looking cyclical stock sectors, while dialling up our exposure to more defensive areas. This reflects the current mood of the market, where the performance of cyclical stocks versus their defensive counterparts has turned a corner in favour of the latter (see Fig. 3). 

Fig. 3 - Cyclicals' strong run to hit buffers?
Relative performance of global cyclical and reflation trades
Equities - cycliclas.png

Source: Refinitiv Datastream, MSCI, Pictet Asset Management. Data covering period 01.01.2020-26.05.20201. 

Which is why we are downgrading consumer discretionary stocks to underweight and closing our overweight position in industrials – the most expensive sector in our model, and one which may soon feel the pinch from a possible deterioration in manufacturing surveys.

On the flip side, we are turning less negative on health care and utilities, upgrading both to neutral. Defensive stocks’ valuations are quite attractive in relative terms. Furthermore, utilities tend to hold up fairly well in times of rising inflation.

However, we’ve stopped short of going fully defensive. We maintain our overweight in financials and real estate. These are the most attractive sectors in an environment in which bond yields are rising and economies re-opening. They are also two of the three cheapsed sectors based on their own 20-year history, according to our model. As rents in real estate are usually tied to price indices, the sector can also offer a degree of inflation protection.

Separately, we see growing potential in UK stocks – by far the cheapest developed equity market, and one which is likely to benefit from an improving domestic economy. Here, daily services indicators are recovering, supported by a swift vaccine rollout. Also, we like the UK’s sector mix; it has a higher than average proportion of financials and quality stocks – sectors we believe should do well during this phase of the business cycle. In contrast, the economic backdrop in Japan is looking more gloomy, prompting us to downgrade Japanese equities to neutral. 

We are not attracted to US stocks, which are the most expensive among the regions we cover. Current price-to-earnings ratios (of over 22.5 times based on 12-month forward EPS) can only be sustained if trend economic growth is unchanged, company profit margins stabilise at above average levels and bond yields remain well below 2 per cent. By our estimates, the S&P 500’s fair value is around 3,600 points1 – some 14 per cent below current levels.

03

Fixed income and currencies: sticking with the havens

With economic growth in China and the US set to moderate in the second half of the year after a rapid recovery from the pandemic, conditions should favour some defensive fixed income assets.

Global manufacturing activity – though still expanding - recently saw its biggest decline outside of recessions since 1995 while China’s industrial production and construction activity has also lost momentum.

Against this backdrop, we maintain our overweight stance in US Treasuries and Chinese bonds.

We think the Fed will keep its ultra-easy monetary programme largely in place until early next year - a view that has been reinforced by repeated comments from central bank officials in recent weeks. We also take our cues from recent developments in money markets. 

In May, the Fed began conducting money market operations to temporarily drain cash balances from the banking system. Measures like this highlight the problems the central bank faces trying to retain control of a system that is awash with cash. Just as importantly, however, they also allow the Fed to test the impact of operations that reduce liquidity, potentially offering it a route to rein in stimulus without causing major market ructions.

Fig. 4 - US bonds outperforming
10-year US-German yield government bond yield differentials
Yield differentials.png
Source: Refinitiv, data covering period 26.05.2020 – 26.05.2021

We’re also overweight Chinese government bonds. There are several strands to our thesis. 

A slowdown in growth in world’s second largest economy – in part a reflection of a steady drop in the country’s credit impulse1 – should support the asset class. 

More broadly, Chinese bonds also offer attractive diversification as their returns are not highly correlated with those of asset classes.

The correlation of returns from renminbi-denominated bonds with those of US and European government debt and equities, for example, is less than 0.2.2

Moreover, Chinese bonds have exhibited remarkable resilience during the Covid crisis. 

We are neutral on other emerging market debt. Inflationary pressures are building across emerging markets, with CPI having risen above central bank targets in several countries, forcing policymakers to tighten monetary policy.

What’s more, a slowdown in Chinese growth will limit the upside for emerging currencies – a key source of return for local currency emerging market bonds.

We maintain our underweight position in US high yield bonds. The asset class remains vulnerable to tighter monetary conditions as yield spreads remain near the low seen in the previous cycle in late 2008, while corporate leverage is at a record level for US non-financials.3 Elsewhere, we are neutral other corporate bonds.

On currencies, we are broadly neutral on the US dollar. The US currency should stabilise before it resumes its secular downtrend later in the year when economic growth loses steam, rekindling concerns about fiscal and current account deficits. We maintain our underweight in sterling.

04

Global markets: exuberance prevails

The sun shone on most asset classes during May – apart from the dollar, which weakened significantly. Riskier assets are being underpinned by central bank liquidity, not least from the Fed and a by a largely event-free reopening of European and US economies. But fears that the central bank will end up being slow to respond to rising inflation is weighing on the greenback.

Gold was the big winner in the month, lifted 7.7 per cent by inflation concerns, leaving the precious metal up marginally on the year after previous slippage. Gold’s performance stood in sharp contrast to that of Bitcoin (see Fig. 5). But oil and other commodities also gained ground – and not just on the back of higher anticipated demand. Investors sought physical stores of value to hedge against the risk that the recent pickup in inflation turns not as transitory as central bankers believe it to be.

The dollar lost 1.4 per cent on the month, leaving it treading water on the year to date. By contrast equities gained further ground, up 1 per cent in local currency terms during May for an 11 per cent gain since the start of the year. Bonds fared relatively well too, up modestly after suffering losses during recent months.


Fig. 5 - Divergent
Bitcoin and gold prices, USD
Markets - bitcoin gold.png

Source: Refinitiv Datastream, Pictet Asset Management. Data covering period 01.01.2020-26.05.2021. 

In equities, there was a slight shift in focus away from the US to Europe and emerging markets beyond Asia, both of which are lagging the US in the post-Covid recovery cycle. Stocks in the single currency region gained by more than 2 per cent on the month in local currency terms, while Swiss stocks were up by over 3 per cent. Emerging Europe Middle East and African equities picked up 3 per cent and Latin American stocks were up by more than 5 per cent.

Commodity-related equity sectors did well, with energy stocks up by almost 5 per cent and materials up some 3 per cent. Energy is now the strongest sector year to date, up more than 24 per cent, though financials, which also did well during the month, run it a close second with a 22 per cent gain in 2021 so far.

Sovereign bonds edged higher on the month, though they’ve almost all had a poor year so far. The month’s best performers were emerging market local and hard currency bonds, up 2.5 per cent and 1 per cent respectively. Elsewhere in fixed income markets, US and EM corporate bonds gained ground, as did European and US high yield markets.


05

In brief

barometer june 2021

Asset allocation

We remain neutral equities as we expect economic growth to slow in the coming months.

Equities regions and sectors

We turn a bit more defensive, downgrading allocation industrials and consumer discretionary while adding to holdings in healthcare and utilities.

Fixed income and currencies

We continue to favour US Treasuries and Chinese government bonds.