Select your investor profile:
This content is only for the selected type of investor.
Individual investors?
Overpriced default risk opens opportunities in EM debt
Emerging market debt has been rocked by inflation, rate risks, a rising dollar and geopolitical tensions. But default worries are overdone
Written by

Robert Simpson
Head of Emerging Markets Investment Strategy & Solutions (Fixed Income)
Emerging market debt investors have rarely faced a more complex economic and geopolitical environment. But as this complexity forces many to shy away from the asset class, attractive opportunities have also opened up. That’s particularly apparent in how the markets have priced risks into emerging market (EM) – EM debt default risk is priced at levels that are not only attractive historically but also relative to other asset classes, not least high yield corporate credit.
Re-pricing risk
A significant part of this risk pricing is down to the high level of uncertainty about the likely path global interest rates will take. EM sovereigns are seen to be particularly vulnerable to this interest rate environment given how funding costs could develop and how global liquidity conditions are likely to be affected, such as what happens to capital flows or how a strong dollar makes dollar-priced debt harder to service.
To be sure, the magnitude of repricing of US Treasury bonds has fed through to considerable volatility in EM debt – US 10 year Treasury bond yields have risen to highs of 3.4 per cent in the past 12 months. At the same time, fractured commodity prices – especially food and energy prices, which make up larger proportions of consumption baskets in these countries – have complicated the picture. Some EM economies are significant commodity producers and so have benefited from the surge in prices, while others are suffering.
By default
Issuer-weighted 5-year cumulative default rates 1983-2021, %
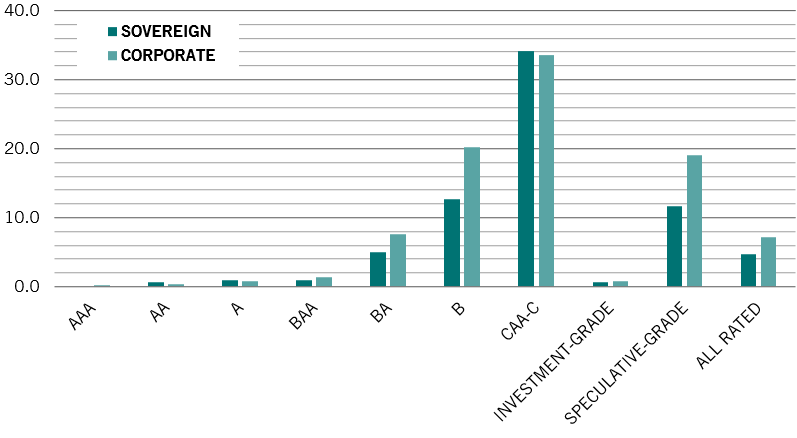
However, investors haven’t always taken into consideration countries’ individual circumstances as they’ve reacted to a global inflation shock and geopolitical crisis. Given the very wide dispersion within the asset class, that, in turn, has left a gap for those able to undertake detailed macroeconomic analysis.
As a result emerging market debt has sold off heavily – the EM dollar denominated sovereign debt index is down 18.3 per cent since the start of the year, while the hard currency is down 18.3 per cent and local index is down 14.2 per cent. This has translated into the market excessively pricing default risk, which is now close to its highs since the global financial crisis (GFC) of 2008. Investors should take note: rising default expectations tend to be met with rising returns. Historically, current default expectations of just under 20 per cent tend to associated with returns of some 10 per cent to 15 per cent a year later.
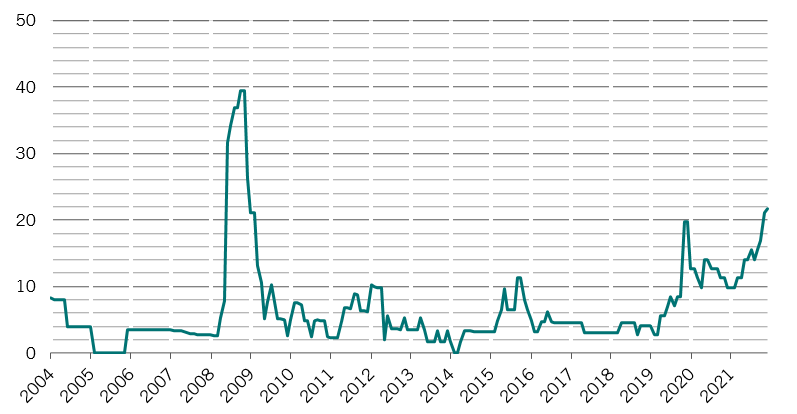
Countries categorised as high yield have suffered some of the biggest losses – spreads on investment grade emerging countries have stayed relatively moderate. But by the same token, the number of countries counting as high yield has been rising with the markets losses. By the end of July, nearly 29 per cent of EM countries were trading at distressed spreads of more than 1000 basis points above US Treasury bonds – a level that flags the risk of possible default. That’s the highest percentage since the GFC and compares with only 4 per cent of countries in mid-2019.
Differentiation creates opportunities
For investors allocating within fixed income, this big and growing differential between investment grade and high yield emerging market debt opens up some interesting opportunities. Take EM debt compared with high yield corporate credit. EM dollar denominated debt trades at a higher spread than equivalently rated US corporate bonds.
That gap is especially significant for at the lowest end of the high yield rating, standing at some 350 basis points for B-rated credit. That’s despite the fact that EM sovereigns have had considerably lower default rates than corporates. In that same B-rated category, EM sovereigns had an average 5-year default rate of 12.7 per cent between 1983 and 2021, compared to a 20.2 per cent default rate for global corporates. Meanwhile, EM sovereign recovery rates – the percentage of defaulted debt’s face value that investors have had returned to them – have averaged a relatively healthy 52 per cent since 1998. By contrast, recovery rates in corporate defaults dropped significantly during the pandemic to stand at 45 cents in the dollar, according to Moody’s.
Spreading worries
Percentage of EMBI countries trading at spreads of 1000 basis points or higher above equivalent US Treasury bonds
The key question confronting investors is how conditions might be different now from the past to justify this excessive market pricing. One concern is that EM debt levels are much higher than they were leading into the pandemic and at the same point in previous global monetary cycles. Based on this alone, rising interest rates would be a significant risk factor to EM debt. But that would also be to ignore the degree to which EM countries were able to issue debt at historically low yields during recent years, and particularly in 2020 when the pandemic sent global interest rates crashing to unprecedented levels. As a result, this debt is being serviced at very low rates and debt service costs as a percentage of GDP are expected to fall over the coming years. This, in turn, makes the risk of wholesale EM sovereign default highly unlikely. Instead, the risk of default is concentrated in smaller, weaker credits with high short-term funding needs that are dependent on food and energy imports.
Although there are challenges facing EM economies in a world where US interest rates are rising, history shows that EM debt performs worst in anticipation of a US tightening cycle. Once the cycle starts – as it has done now – EM debt increasingly come into its own. At that point, the dollar tends to stop appreciating, which takes some pressure off EM economies. And our strategists argue the US currency is significantly overvalued and argue that the dollar is at risk of depreciating more than 10 per cent over the coming five years.
This dynamic, combined with elevated risk premia as seen in high levels of implied probability of default relative to historic experience, suggest that the EM debt market has seen the worst of its losses and that spreads should stop widening. And as monetary normalisation becomes more certain, interest rate volatility should subside allowing spreads to compress again.
Economic revival
At the same time, EM economies are bouncing back. With the exception of China and emerging European economies, growth rates for the coming five years are expected to be broadly in line with those of the five years before the pandemic. By region, Latin America, Africa and Gulf Coast Countries and the Middle East should grow faster over the coming five years than they did pre-pandemic.
Within the various regions, Mozambique, Ivory Coast, India, Indonesia, Vietnam, Uzbekistan, Georgia, Panama, Dominican Republic and Colombia are expected to show the strongest performances, with growth rates for these ranging between 3.9 per cent and 7.2 per cent per year. That’s considerably better than the developed world’s strongest expected performer, the US, at 2.2 per cent, and a reversal of the immediate post-pandemic trend. This matters. At a time when developed markets are expected to struggle to grow, EM economies’ strength should draw capital flows and thus boost local debt markets.
The current market environment for emerging market debt seems propitious


Important legal information
This marketing material is issued by Pictet Asset Management (Europe) S.A.. It is neither directed to, nor intended for distribution or use by, any person or entity who is a citizen or resident of, or domiciled or located in, any locality, state, country or jurisdiction where such distribution, publication, availability or use would be contrary to law or regulation. The latest version of the fund‘s prospectus, Pre-Contractual Template (PCT) when applicable, Key Information Document (KID), annual and semi-annual reports must be read before investing. They are available free of charge in English on www.assetmanagement.pictet or in paper copy at Pictet Asset Management (Europe) S.A., 6B, rue du Fort Niedergruenewald, L-2226 Luxembourg, or at the office of the fund local agent, distributor or centralizing agent if any.
The KID is also available in the local language of each country where the compartment is registered. The prospectus, the PCT when applicable, and the annual and semi-annual reports may also be available in other languages, please refer to the website for other available languages. Only the latest version of these documents may be relied upon as the basis for investment decisions.
The summary of investor rights (in English and in the different languages of our website) is available here and at www.assetmanagement.pictet under the heading "Resources", at the bottom of the page.
The list of countries where the fund is registered can be obtained at all times from Pictet Asset Management (Europe) S.A., which may decide to terminate the arrangements made for the marketing of the fund or compartments of the fund in any given country.
The information and data presented in this document are not to be considered as an offer or solicitation to buy, sell or subscribe to any securities or financial instruments or services.
Information, opinions and estimates contained in this document reflect a judgment at the original date of publication and are subject to change without notice. The management company has not taken any steps to ensure that the securities referred to in this document are suitable for any particular investor and this document is not to be relied upon in substitution for the exercise of independent judgment. Tax treatment depends on the individual circumstances of each investor and may be subject to change in the future. Before making any investment decision, investors are recommended to ascertain if this investment is suitable for them in light of their financial knowledge and experience, investment goals and financial situation, or to obtain specific advice from an industry professional.
The value and income of any of the securities or financial instruments mentioned in this document may fall as well as rise and, as a consequence, investors may receive back less than originally invested.
The investment guidelines are internal guidelines which are subject to change at any time and without any notice within the limits of the fund's prospectus. The mentioned financial instruments are provided for illustrative purposes only and shall not be considered as a direct offering, investment recommendation or investment advice. Reference to a specific security is not a recommendation to buy or sell that security. Effective allocations are subject to change and may have changed since the date of the marketing material.
Past performance is not a guarantee or a reliable indicator of future performance. Performance data does not include the commissions and fees charged at the time of subscribing for or redeeming shares.
Any index data referenced herein remains the property of the Data Vendor. Data Vendor Disclaimers are available on assetmanagement.pictet in the “Resources” section of the footer. This document is a marketing communication issued by Pictet Asset Management and is not in scope for any MiFID II/MiFIR requirements specifically related to investment research. This material does not contain sufficient information to support an investment decision and it should not be relied upon by you in evaluating the merits of investing in any products or services offered or distributed by Pictet Asset Management.
Pictet AM has not acquired any rights or license to reproduce the trademarks, logos or images set out in this document except that it holds the rights to use any entity of the Pictet group trademarks. For illustrative purposes only.